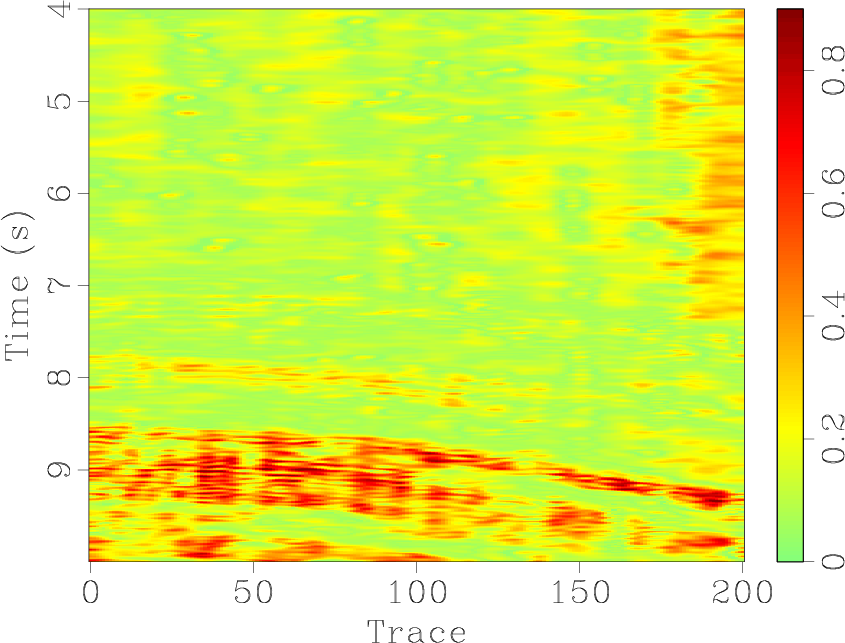
The example in rsf/tutorials/attr reproduces the tutorial from Matt Hall on analyzing trace attributes. For more explanation, see Matt’s blog post An attribute analysis primer.
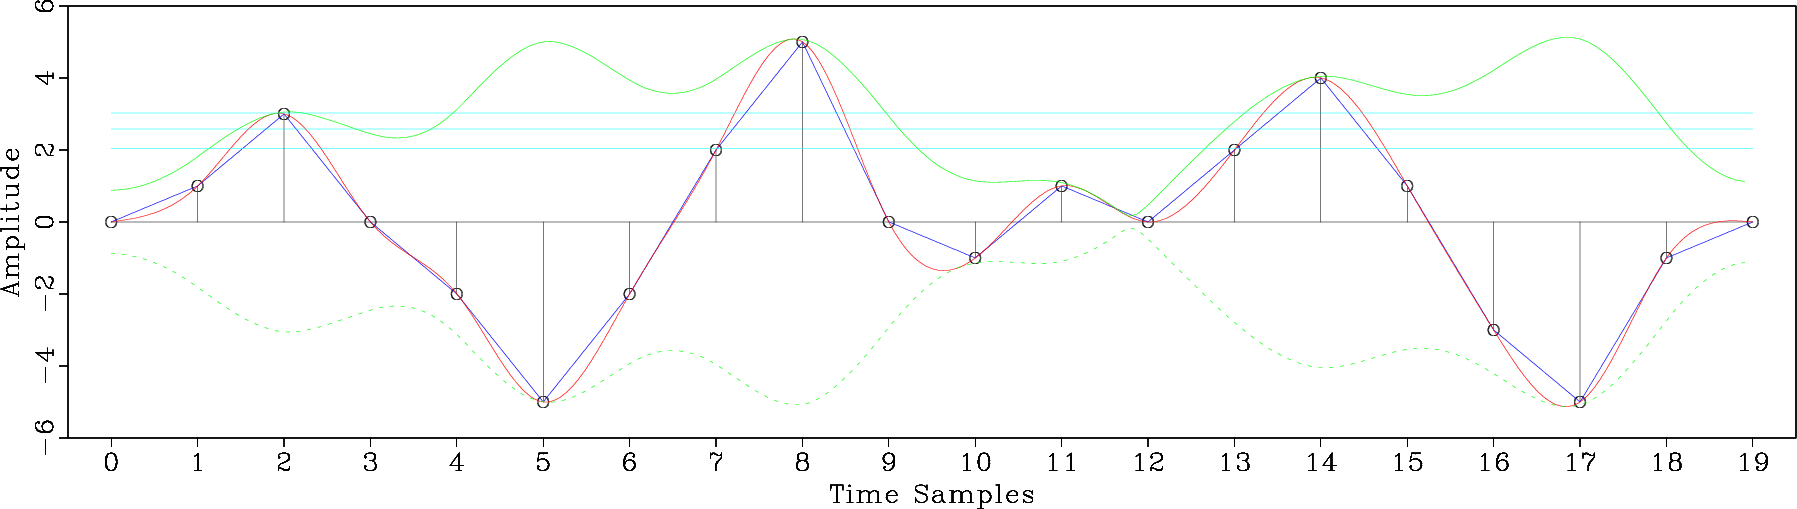
Madagascar users are encouraged to try improving the results.
September 22, 2015 Examples No comments
The example in rsf/tutorials/attr reproduces the tutorial from Matt Hall on analyzing trace attributes. For more explanation, see Matt’s blog post An attribute analysis primer.
Madagascar users are encouraged to try improving the results.
September 15, 2015 Documentation No comments
A new paper is added to the collection of reproducible documents: On anelliptic approximations for qP velocities in TI and orthorhombic media

Anelliptic approximations for phase and group velocities of qP waves in transversely isotropic (TI) media have been widely applied in various seismic data processing and imaging tasks. We revisit previously proposed approximations and suggest two improvements. The first improvement involves finding an empirical connection between anelliptic parameters along different fitting axes based on laboratory measurements of anisotropy of rock samples of different types. The relationship between anelliptic parameters observed is strongly linear suggesting a novel set of anisotropic parameters suitable for the study of qP-wave signatures. The second improvement involves suggesting a new functional form for the anelliptic parameter term to achieve better fitting along the horizontal axis. These modifications lead to improved three-parameter and four-parameter approximations for phase and group velocities of qP waves in TI media. In a number of model comparisons, the new three-parameter approximations appear to be more accurate than previous approximations with the same number of parameters. These modifications also serve as a foundation for an extension to orthorhombic media where qP velocities involve nine independent elastic parameters. However, as shown by previous researchers, qP wave propagation in orthorhombic media can be adequately approximated using just six combinations of those nine parameters. We propose novel six-parameter approximations for phase and group velocities for qP waves in orthorhombic media. The proposed orthorhombic phase-velocity approximation provides a more accurate alternative to previously known approximations and can find applications in full-wave modeling, imaging, and inversion. The proposed group-velocity approximation is also highly accurate and can find applications in ray tracing and velocity analysis.
September 15, 2015 Documentation No comments
A new paper is added to the collection of reproducible documents: Iterative deblending with multiple constraints based on shaping regularization

It has been shown previously that blended simultaneous-source data can be successfully separated using an iterative seislet thresholding algorithm. In this paper, I combine the iterative seislet thresholding with the local orthogonalization technique via the shaping regularization framework. During the iterations, the deblended data and its blending noise section are not orthogonal to each other, indicating that the noise section contains significant coherent useful energy. Although the leakage of useful energy can be retrieved by updating the deblended data from the data misfit during many iterations, I propose to accelerate the retrieval of leakage energy using iterative orthogonalization. It is the first time that multiple constraints are applied in an underdetermined deblending problem and the new proposed framework can overcome the drawback of low-dimensionality constraint in the traditional 2D deblending problem. Simulated synthetic and field data examples show superior performance of the proposed approach.
September 14, 2015 Programs No comments
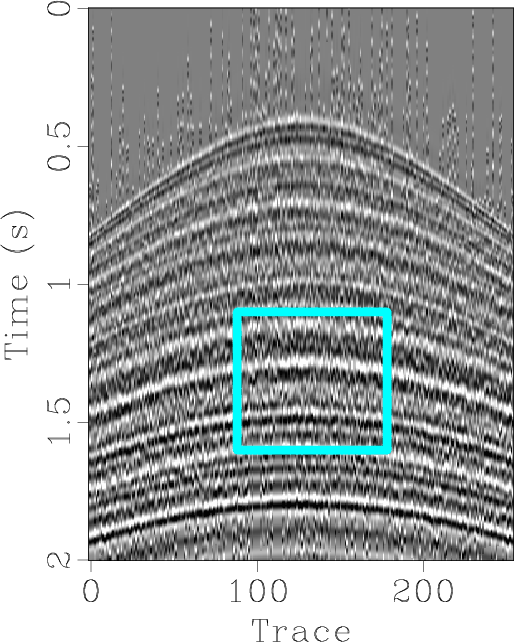
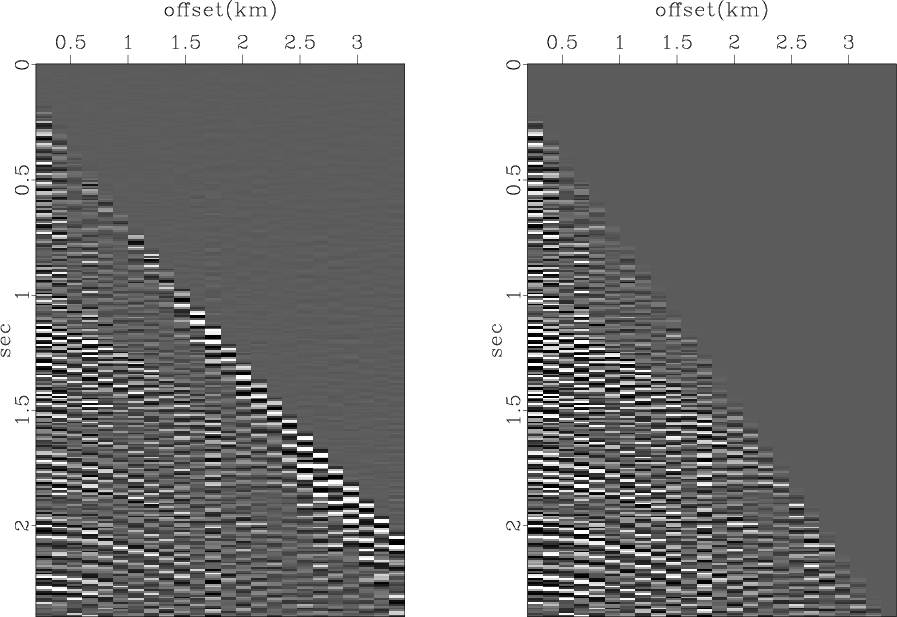
sfsimilarity computes the local similarity attribute between two datasets.
The following example from tccs/ortho/orthofair shows two 2-D sections and their local similarity.
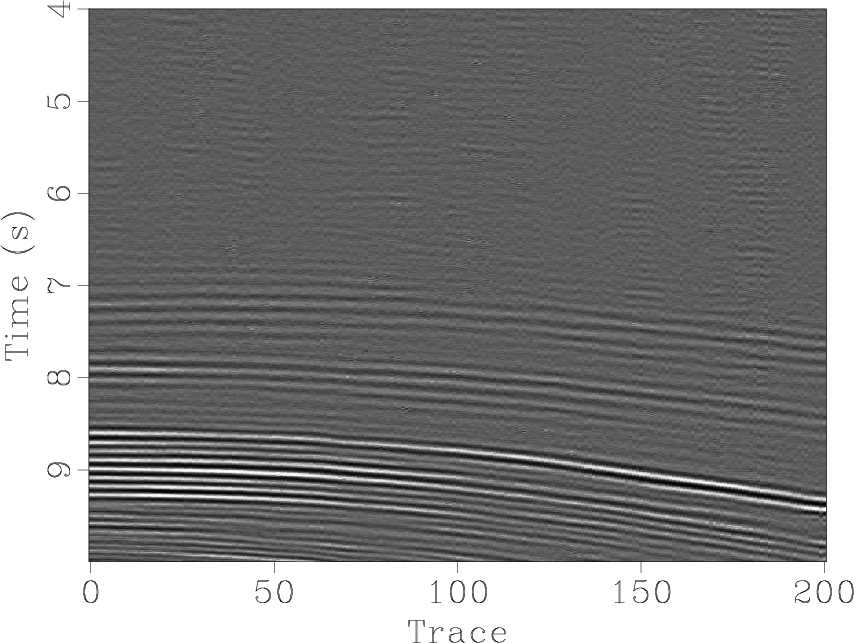
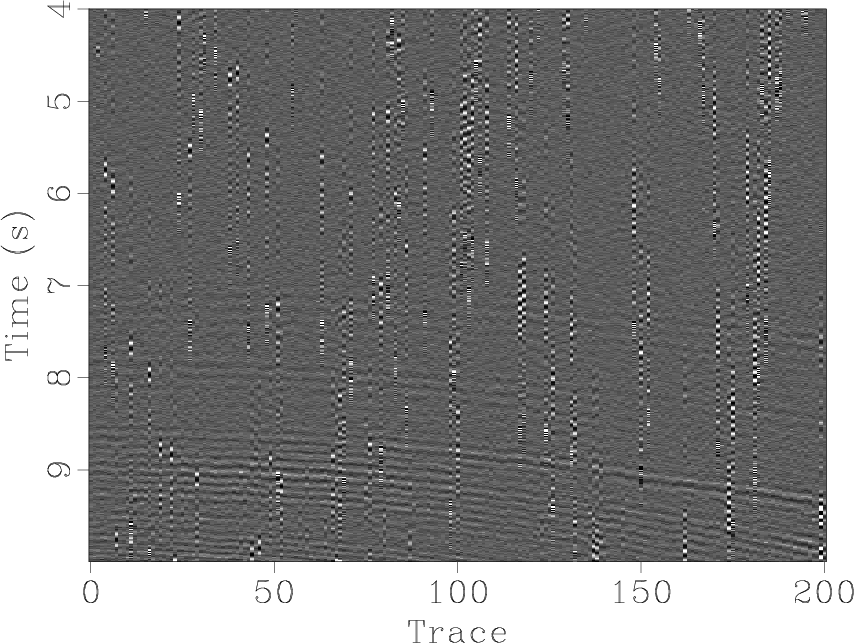
The second dataset for computing the local similarity is specified by other=. The program performs iterations of shaping regularization. The main controling parameters are the number of iterations niter= and the smoothing radii in different dimensions rect1=, rect2=, etc. The iterations can be additionally accelerated using the eps= parameters. To suppress the output of iteration statistics on the screen, use verb=n.
August 30, 2015 Celebration 1 comment
The first Madagascar school for advanced users took place in Qingdao, China, on August 8-9, 2015, and was hosted by the China University of Petroleum (East China).
The local organizers were Professor Qizhen Du (China University of Petroleum) and Dr. Gang Fang (Qingdao Institute of Marine Geology).
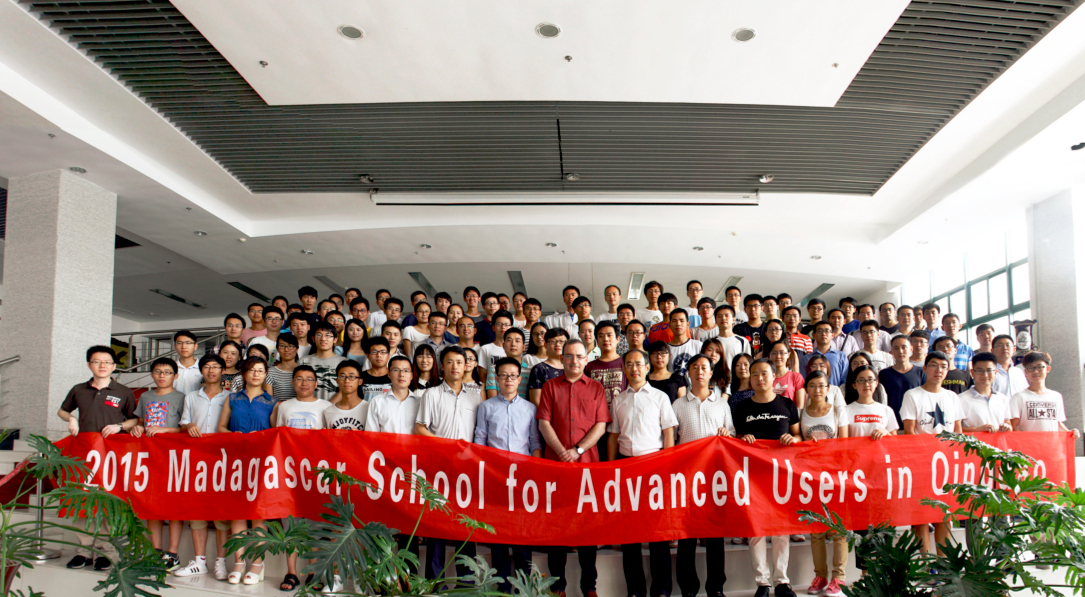
The school attracted more than 100 participants from 15 different organizations, including 10 Chinese universities. The program included not only lectures on different advanced topics in the use of Madagascar but also presentations from different users about their personal experiences with using Madagascar for geophysical research. The school materials are available on the website.
The school timing and location cleverly coincided with the famous Qingdao International Beer Festival, the biggest one of its kind in Asia.

August 29, 2015 Links No comments
 This blog is changing its appearance by moving its engine from Serendipity to WordPress. The new engine should make it more convenient to leave comments and to interact with the blog content. Markdown editing is enabled. The old blog will remain available until all links are properly redirected. According to wappalyzer.com, WordPress currently dominates the market of Content Management Systems (CMS). According to builtwith.com, it powers 50% of all websites on the entire Internet. This is another success story for free and open-source software. The WordPress software was originally developed by Matt Mullenweg and Mike Little and is released under the GPL license.

July 28, 2015 Links No comments

In a major administrative change, the code repository of the Madagascar project, which has been hosted by SourceForge for more than 9 years and more than 12,000 revisions, is being moved to GitHub. The location of the Madagascar project on GitHub is https://github.com/ahay/ The move has been discussed several times previously. The former major hub of open-source projects, SourceForge has been loosing popularity among open-source software developers and went through some bad publicity recently because of their practice of injecting malware into open-source projects. The final straw, which prompted our move, was the whole cite going down in July 2015 and taking more than a week to restore access to repositories. DHI Group, Inc. announced today its plans to sell the Slashdot Media business, which includes Slashdot and SourceForge.
GitHub brings a social-networking aspect to open-source software development, as well as many other useful tools and enhancements. Its success story was desribed in the recent article in Wired How GitHub Conquered Google, Microsoft, and Everyone Else.
![]()
The repository has been converted to Git, but if you prefer to use Subversion, you can continue to do so thanks to the svn bridge. See https://www.ahay.org/wiki/Download#Currentdevelopmentversion for instructions. If you need a developer access to commit changes directly to the master branch of the repository, please register at GitHub and send your GitHub login name to the project administrator. Everyone else should be able to participate in the project development by using Git’s preferred way of “pull requests”.
July 12, 2015 Systems No comments
The most popular colormap in Madagascar, other than the default greyscale, is color=j, modeled after “jet“, which used to be the default colormap in MATLAB. More than 1,000 Madagascar examples use color=j. In October 2014, with release R2014b (Version 8.4), MATLAB switched the default colormap to a different one, called “parula“. The “parula” colormap is copyrighted by MathWorks as a result of a creative process (solving an optimization problem). No open-source license is given to use it outside of MATLAB. According to Steve Eddins, “this colormap is MathWorks intellectual property, and it would not be appropriate or acceptable to copy or re-use it in non-MathWorks plotting tools.” Stéfan van der Walt and Nathaniel Smith from the Berkeley Institute for Data Science have developed several new open-source colormaps with good perceptual properties. One of them (named “viridis“) is proposed as a good replacement for “jet” and as the default colormap in matplotlib 2.0. 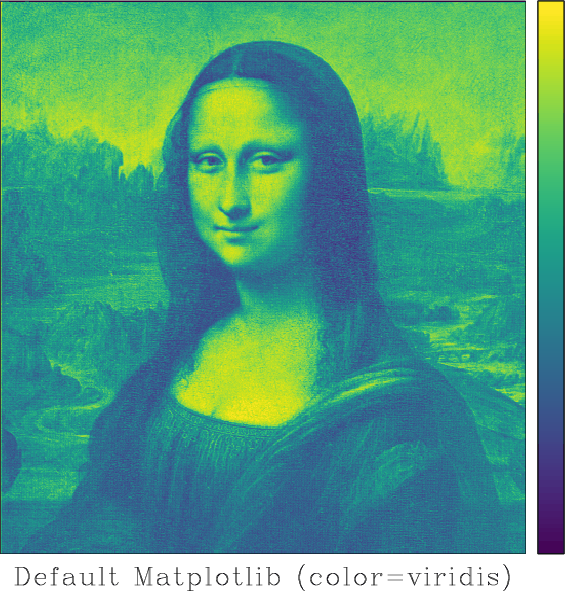 Is it a good colormap? We can find out by using tools from Matteo Niccoli’s tutorial on colormaps.
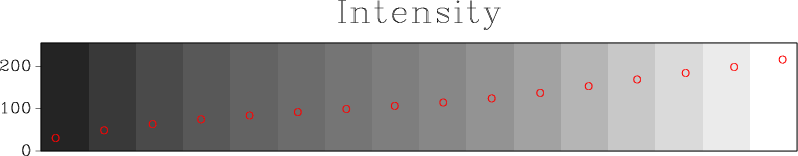
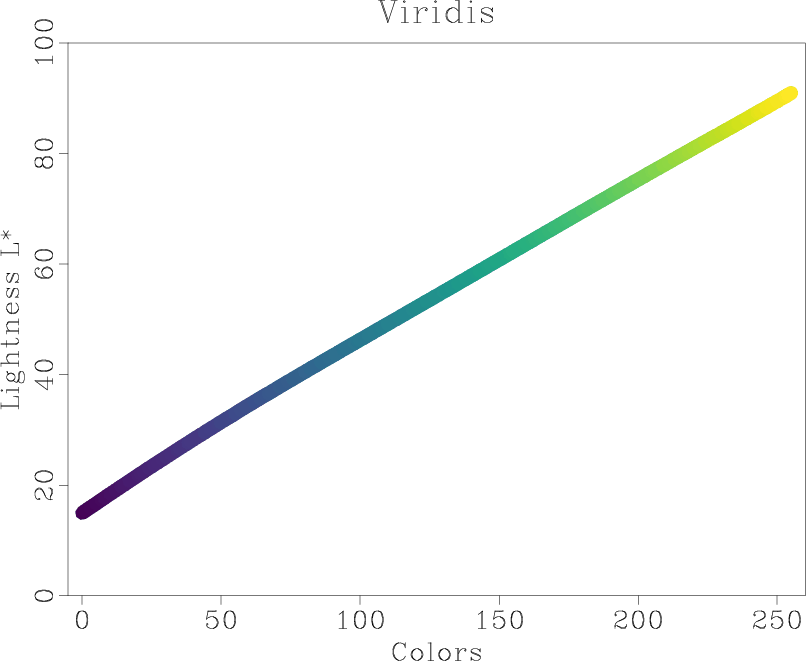
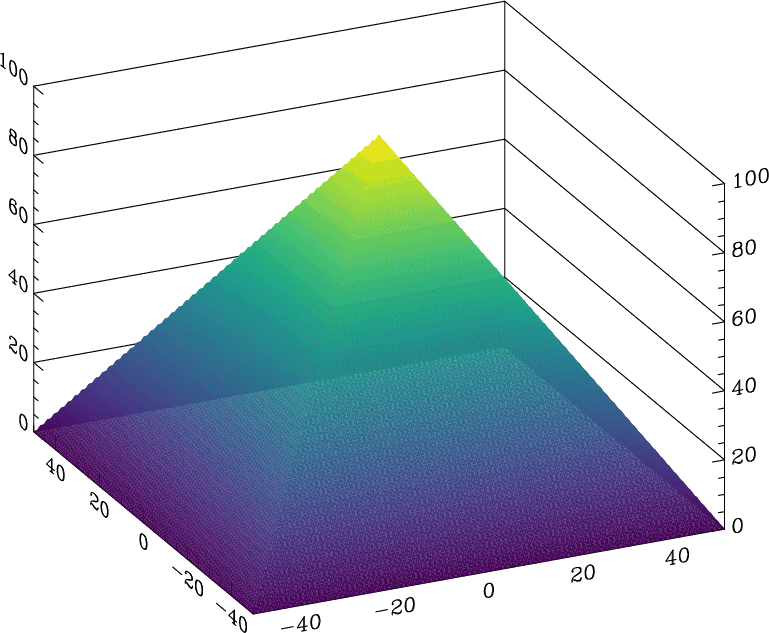 This analysis shows the intensity and lightness distributions of “viridis” are nicely linear. In his presentation at SciPy-2015, Nathaniel Smith explains the rational for this choice.
July 10, 2015 Celebration No comments
sfmutter performs a mute operation, common in prestack seismic data processing.
The following example from bei/wvs/vscan shows a seismic CMP gather before and after a mute.
sfmutter multiples the input by a weight, which follows the equation
$$W(t,x) = \left\{\begin{array}{rl} 0 & \quad \mbox{for} \quad t – t_0 < p_0\,(x-x_0) \\ 1 & \quad \mbox{for} \quad t – t_0 > \Delta t + p_1\,(x-x_0) \end{array}\right.$$
The weight is smoothly interpolated in between the two regions. Different parameters appearing in this equation can be specified as inputs for sfmutter: t0= and x0= correspond to $t_0$ and $x_0$; tp= corresponds to $\Delta t$; slope0= and slopep= correspond to $p_0$ and $p_1$, respectively. The slope can be specified by velocity v0= such that $p_0=1/v_0$. By default, $p_1=p_0$.
The parameter half= indicates whether the horizontal axis corresponds to half-offset instead of the full offset (true by default). In case of irregular offsets, they can be provides in a file specified by offset=. The parameter abs= controls whether to use the absolute value of the offset in the calculation of the mute (true by default).
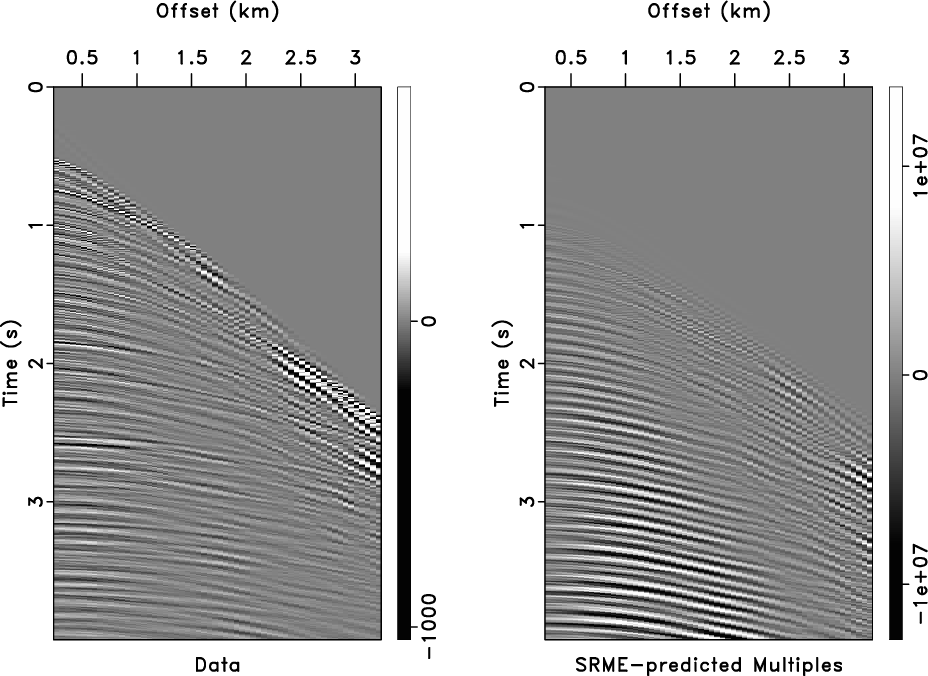
To make a hyperbolic mute, instead of the default linear mute, use hyper=y. In this case, the equation changes to
$$W(t,x) = \left\{\begin{array}{rl} 0 & \quad \mbox{for} \quad (t-t_0)^2 < p_0^2\,(x-x_0)^2 \\ 1 & \quad \mbox{for} \quad (t-t_0)^2 > (\Delta t)^2 + p_1^2\,(x-x_0)^2 \end{array}\right.$$
The following example from xjtu/mcaseislet/sep2 applies a hyperbolic mute for an SRME prediction of surface-related multiple reflections:
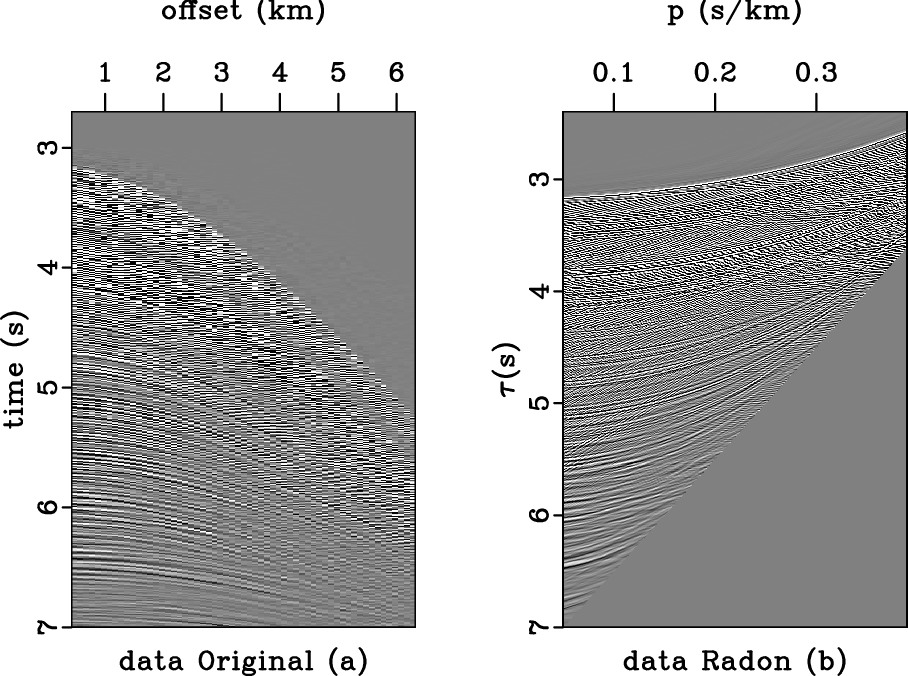
For inner mute, specified by inner=y, the signs in the equation are reversed. The following example from milano/taupvel/cmp applies an inner mute to a Radon-transformed CMP gather:
July 8, 2015 Examples No comments
The example in rsf/tutorials/petro1 reproduces the tutorial from Alessandro Amato del Monte on seismic petrophysics (Part 1). The tutorial was published in the April 2015 issue of The Leading Edge.
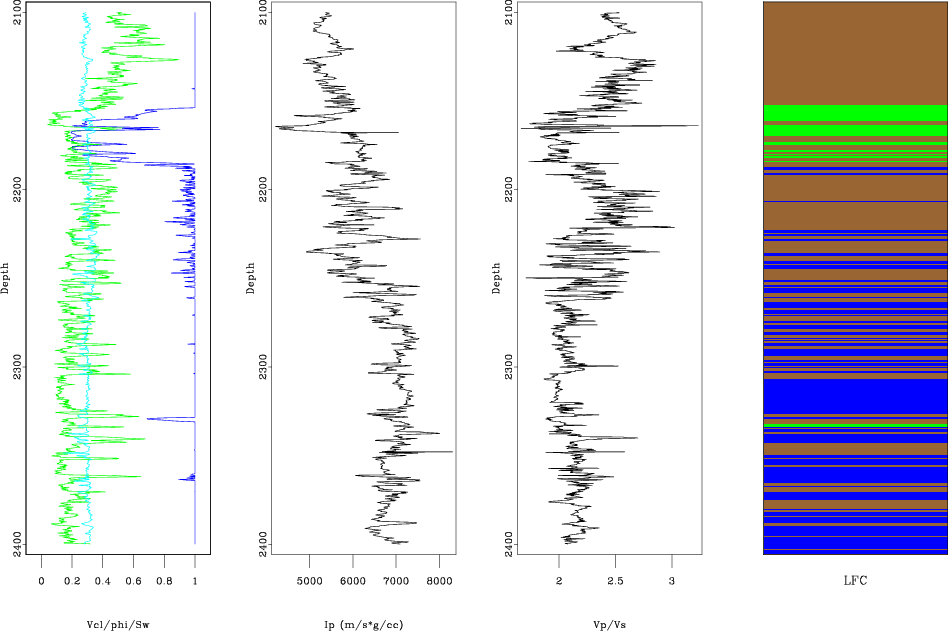

Madagascar users are encouraged to try improving the results.