sfmax1 finds local maxima along the first axis of the input. It takes floating-point input but outputs complex numbers, where the real part stands for the location of the local minima and the imaginary part stands for the value of the input at local minima.
The number of minima to output is controlled by np= parameter. To control the range for the minima locations (in the case that it is smaller than the full range of the data), use min= and max=. The output is sorted by value so that the largest maxima appear first. Here is a quick example. Let us create some data:
bash$ sfmath n1=5 output="sin(x1)" > data.rsf
bash$ bash$ < data.rsf sfdisfil
   0:             0       0.8415       0.9093       0.1411      -0.7568
Observing the data values, we can suspect that the local maximum is between 1 and 2.
sfmax1 uses local parabolic interpolation to locate the minimum at 1.581 with the value of 0.9826.
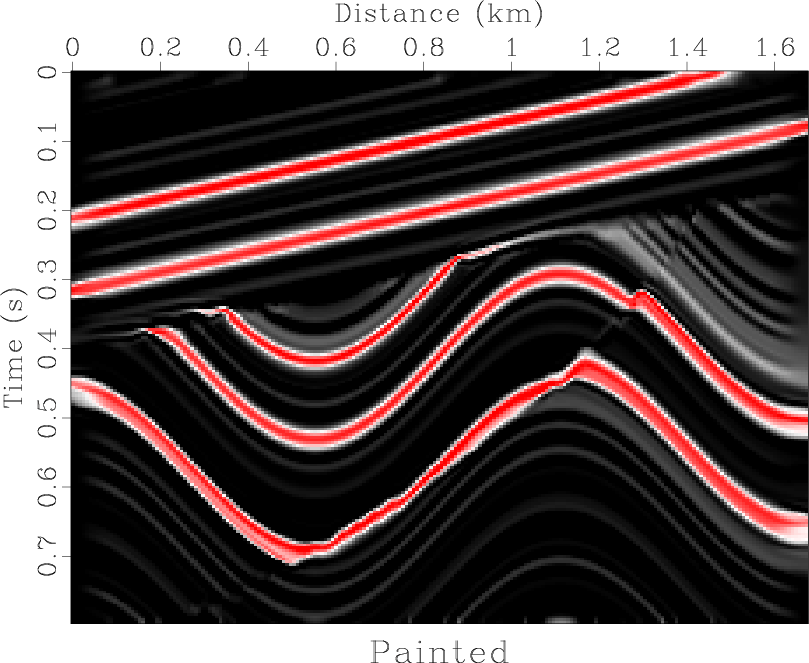
In the following example, from tccs/flat/flat, sfmax1 is used to locate the strongest-amplitude horizons for predictive painting.
codemore code
~~~~