A new paper is added to the collection of reproducible documents:
A reversible transform for seismic data processing

Reversible transform
August 29, 2011 Documentation No comments
Open-source governance
In a recent report, VisionMobile points out that Open Source is not only about licensing but also about the governance model adopted by open-source projects.

The governance model used by an open source project encapsulates all the hard questions about a project. Who decides on the project roadmap? How transparent are the decision-making processes? Can anyone follow the discussions and meetings taking place in the community? […] Governance determines who has influence and control over the project or platform beyond what is legally required in the open source license.
The governance model adopted by Madagascar is exceptionally flat and open. So far, 50 people have been given write access to the Subversion repository. Nobody who asked for an access has been denied it so far. Everyone of the 50 developers has equal rights to add, remove, or modify code. We coordinate our efforts through the developer mailing list and annual meetings. This open governance model is a distinctive feature of the Madagascar project, which should be emphasized when comparing it with other projects. VisionMobile states in its report: “Our research suggests that platforms that are most open will be most successful in the long-term.”
Program of the month: sfgraph
August 9, 2011 Programs 4 comments
sfgraph belongs to the family of plotting programs and is used for plotting explicitly defined 2-D curves.
Here are 10 basic facts about this program:
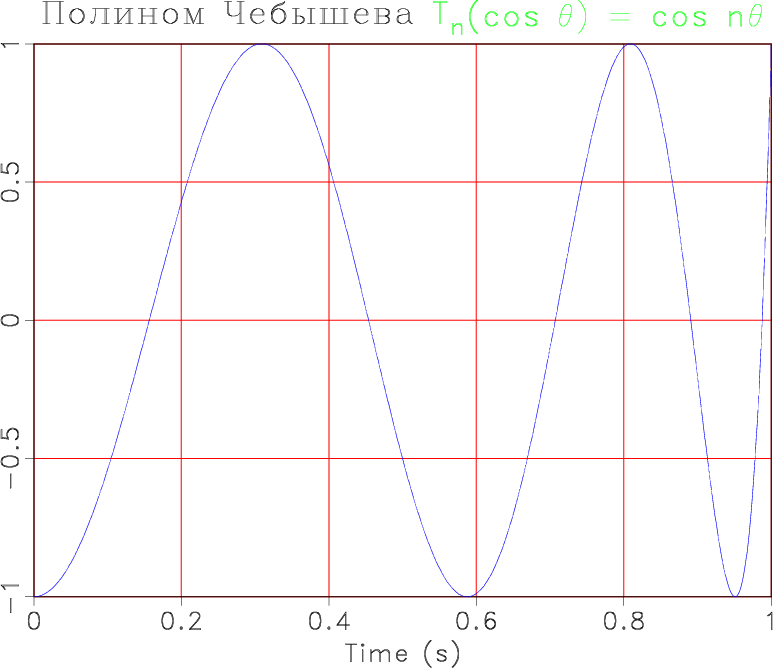
- sfgraph shares most of its parameters with some other 2-D plotting programs (sfgrey, sfcontour, sfwiggle). These common parameters can be accessed by running sfdoc stdplot. The following plot from rsf/rsf/sfgraph is using parameters grid=y gridcol=5 pad=n and some creative changes of fonts in the title.
- If the input to sfgraph is real, it is understood as representing a regularly sampled 1-D function Y(X), where X is sampled according to n1=, o1=, and d1= parameters in the input file.
- If the input is complex, its real part is taken as X, and the imaginary part is taken as Y. If the input is real initially, it is easy to turn it into complex by using sfcmplx or sfdd.
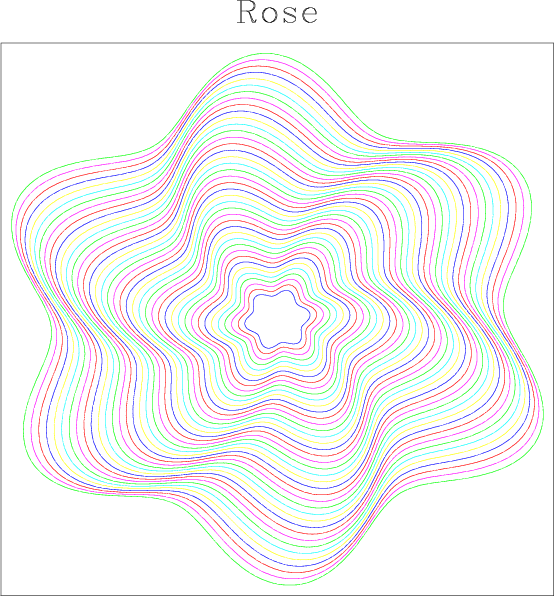
- If the n2 parameter in the input is greater than 1, multiple curves are plotted. The following plot from rsf/rsf/sfmath shows plots of closed curves defined by a complex-valued input.
- If the n3 or any of the larger dimensions is greater than 1, the plot becomes a movie.
- By default, the graphs are plotted with lines. One can control the line appearance with generic parameters dash=, plotcol=, plotfat=.
The following plot from jsg/seislet/sin2 contained dashed lines created with dash=1,2,0.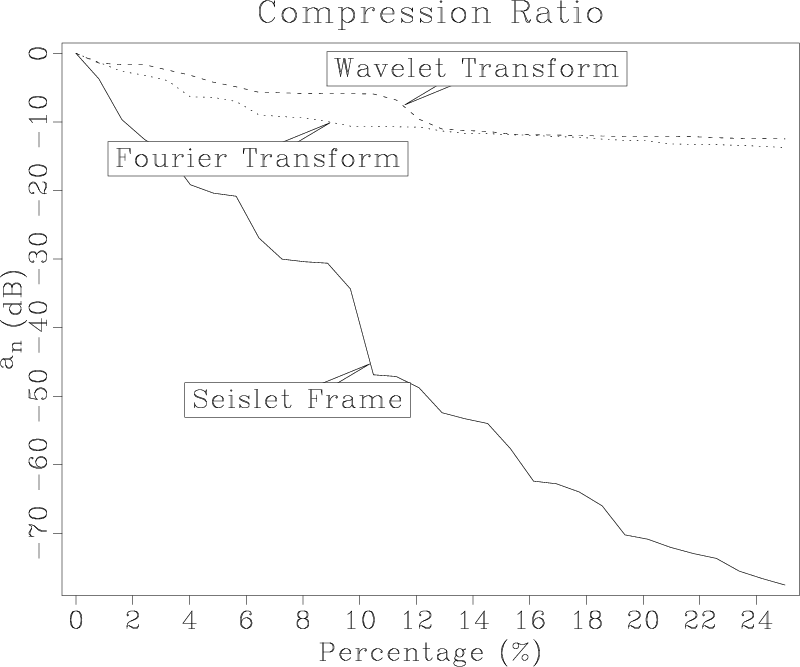
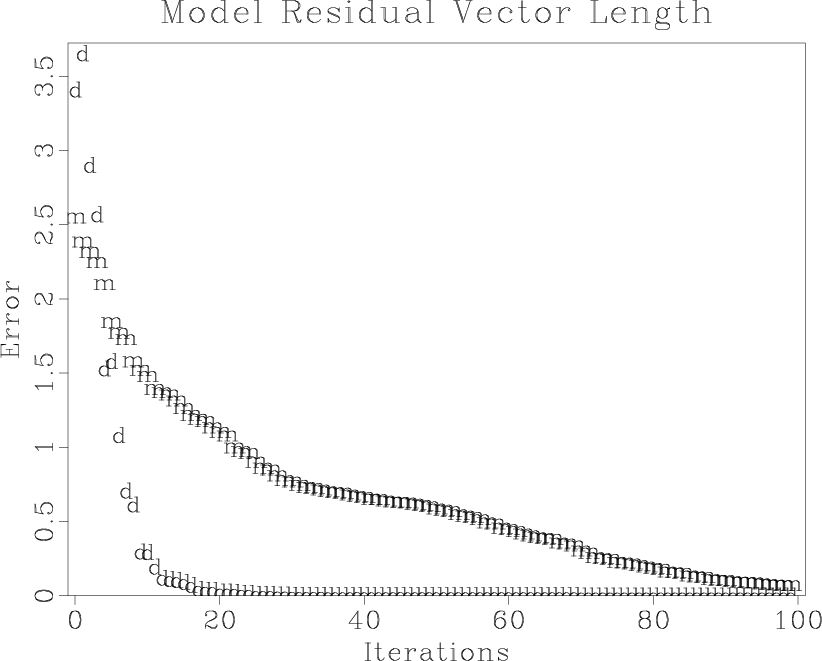
- If symbol= is specified, the graph is plotted with the given symbols. The size of the symbol is controlled with symbolsz=. The following plot from sep/precon/oned is created with symbol=”md” symbolsz=7.
- The displayed function can be changed from $Y(X)$ to $X(Y)$ by using transp= parameter. The following plot from jsg/nmo3/azimuthtest is created with transp=y yreverse=y symbol=+ symbolsz=4.

- The ranges of $X$ and $Y$ are selected automatically but can be controlled with min1=, max1=, min2=, max2=.
If you want automatic ranges, but no padding around minimum and maximum values, use pad=n. - sfgraph avoids plotting infinite or NaN (not a number) values.
Event of the year 2011
August 5, 2011 Celebration 3 comments

The Madagascar school in Beijing was a blast! Many thanks to Yibo Wang and Yang Liu (x 2) for the excellent organization and tremendous hospitality. Nearly 230 people attended, representing 12 Chinese universities, 5 companies, and the Chinese Academy of Sciences. The school materials are available now on the website.