|
|
|
|
Relative time seislet transform |
Next: 2D Field Data Example Up: Geng et al.: RT-seislet Previous: Workflow
|
|
|
|
Relative time seislet transform |
|
|---|
|
rt
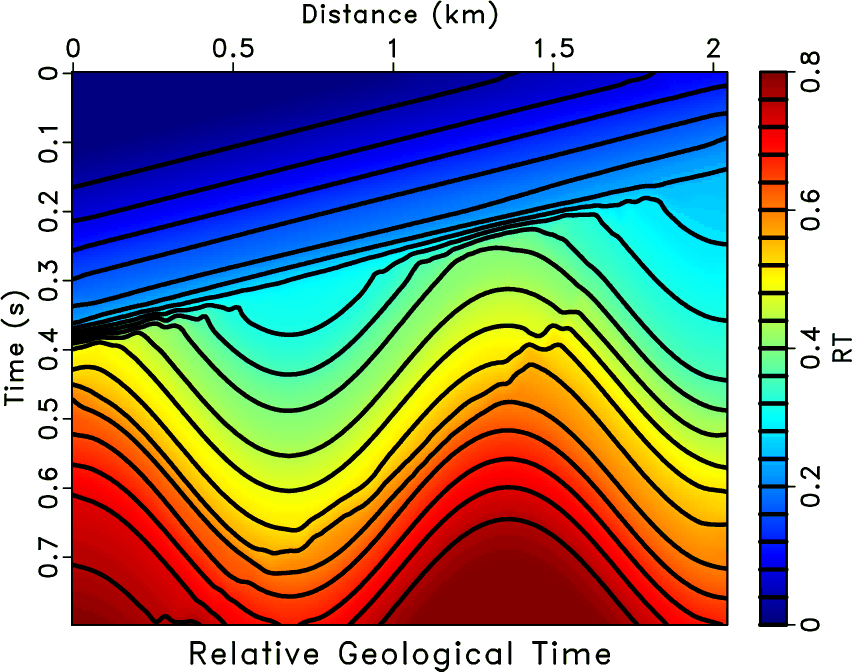
Figure 8. RT volume estimated by the predictive painting using multiple reference traces. |
|
|
|
|---|
|
pwdseisrec1,rtseisrec1
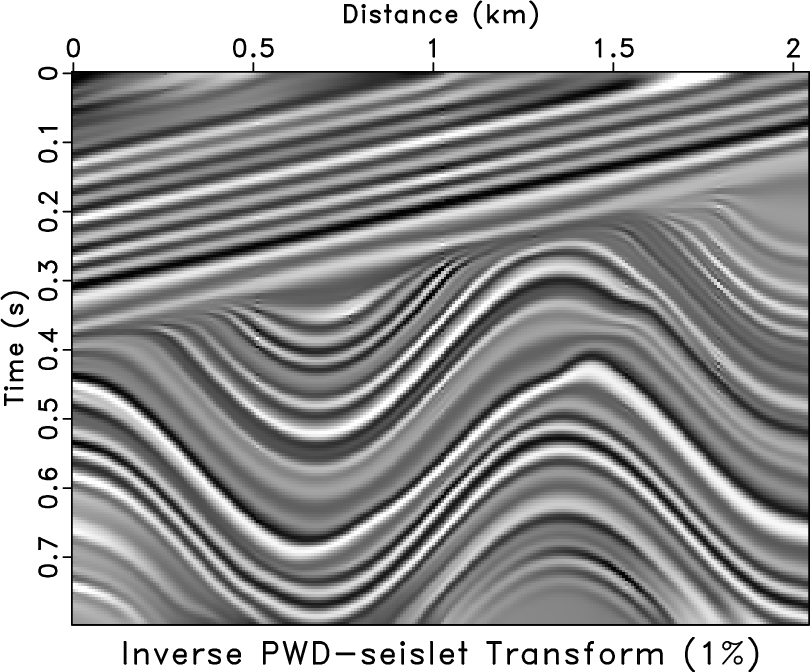
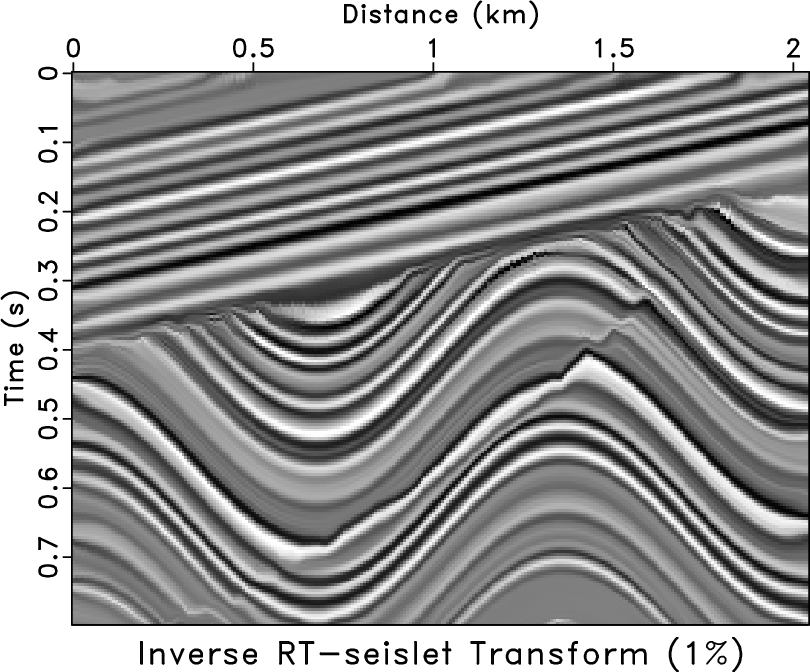
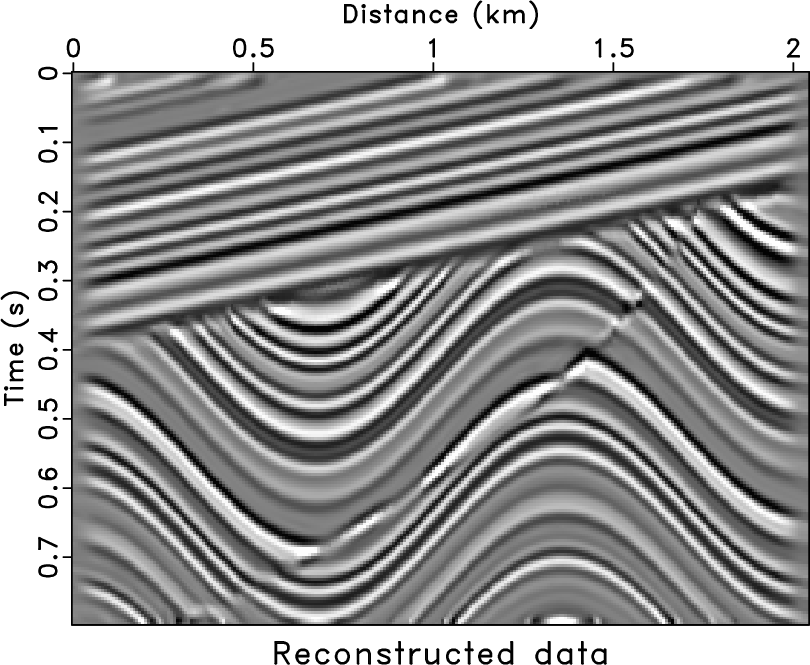
Figure 9. Synthetic seismic image reconstruction by thresholding coefficients and keeping only 1% of significant coefficients using (a) inverse PWD-seislet transform and (b) inverse RT-seislet transform. |
|
|
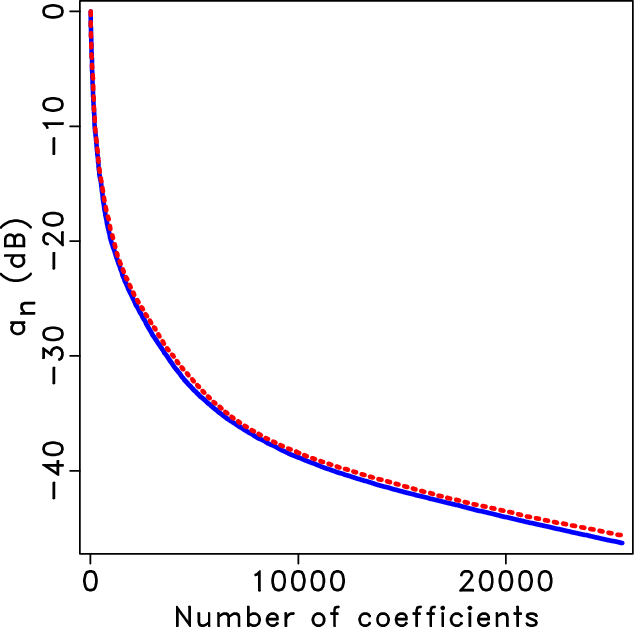
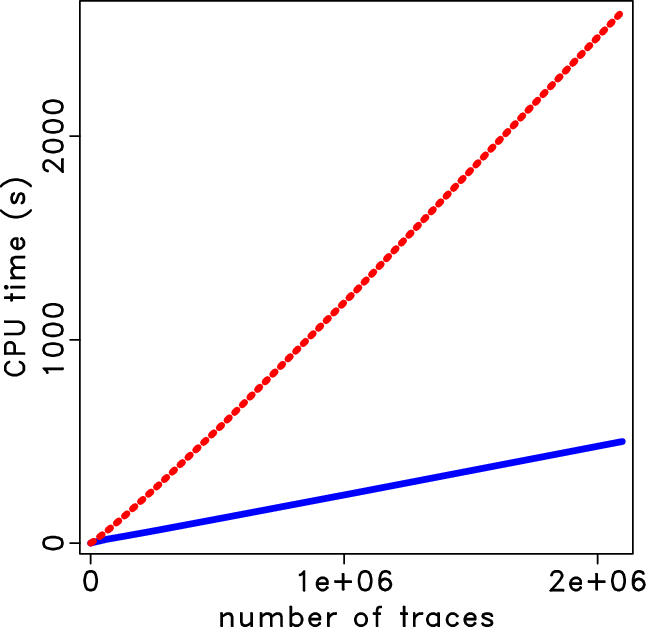
The comparison between coefficients from the PWD-seislet transform and the RT-seislet transform is shown in Figure 10. The minor difference of their decay rate indicates that the PWD-seislet transform and the proposed transform obtain the same sparsity for the input data. Figure 11 shows the plot of CPU time against the number of traces. The proposed formulation of the seislet transform shows promising computation efficiency since the prediction of a trace using distant traces is accomplished directly instead of recursively as in the original PWD-seislet transform.
|
|---|
|
coef
Figure 10. Normalized coefficients from the PWD-seislet transform (red dashed line) and the RT-seislet transform (blue solid line) sorted from large to small on a decibel scale. |
|
|
|
|---|
|
tim
Figure 11. CPU time of the PWD-seislet transform (red dashed line) and the RT-seislet transform (blue solid line) versus the number of traces. |
|
|
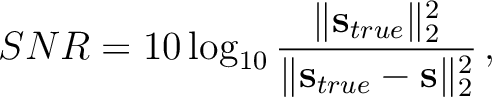
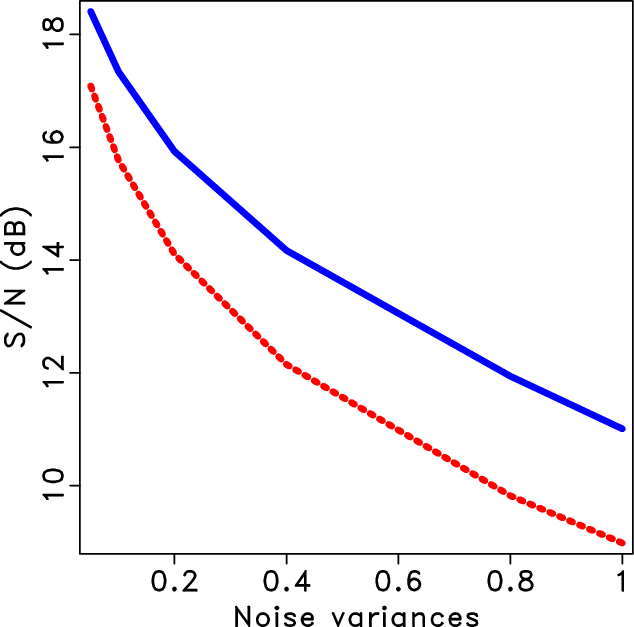
For the purpose of testing the sensitivity of the RT-seislet transform to noise, we add random noise to the synthetic model and utilize signal-to-noise ratio (SNR) as measurement:
where is the original data, and
 denotes
the reconstructed data (e.g., Figure 9b) or noisy data.
We plot SNRs of reconstructed data using the inverse PWD-seislet transform
and the inverse RT-seislet transform with respect to the noise variance in
Figure 12.
Apparently, as the noise level increases, the performance of the RT-seislet
gets worse, which shows that the proposed method is sensitive to noise.
But, compared with the original PWD-seislet transform, the new method has
superior performance that is less sensitive to noise.
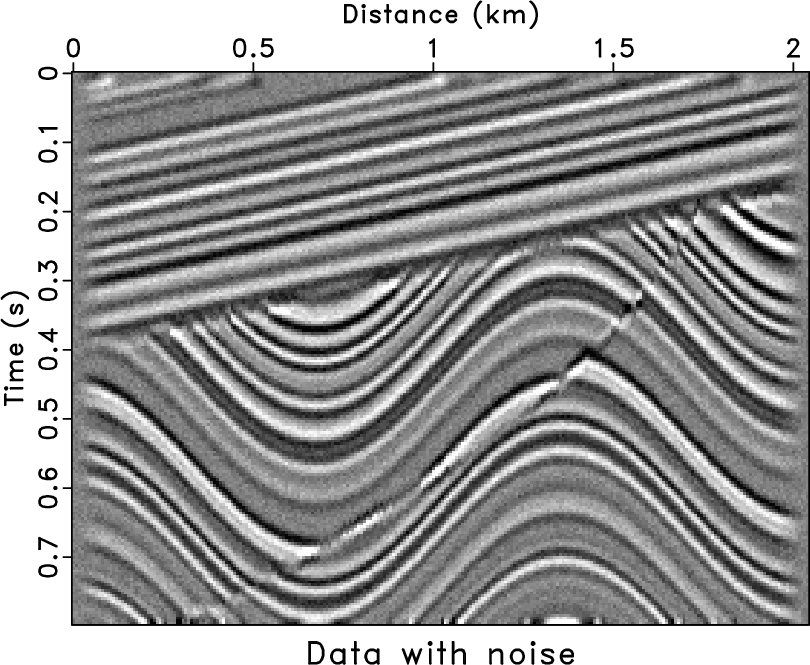
Figure 13 shows one example of the
noisy data and the reconstructed data. The SNR of
Figure 13b is 17.19 dB.
denotes
the reconstructed data (e.g., Figure 9b) or noisy data.
We plot SNRs of reconstructed data using the inverse PWD-seislet transform
and the inverse RT-seislet transform with respect to the noise variance in
Figure 12.
Apparently, as the noise level increases, the performance of the RT-seislet
gets worse, which shows that the proposed method is sensitive to noise.
But, compared with the original PWD-seislet transform, the new method has
superior performance that is less sensitive to noise.
Figure 13 shows one example of the
noisy data and the reconstructed data. The SNR of
Figure 13b is 17.19 dB.
|
|---|
|
snr
Figure 12. SNR diagram of the PWD-seislet transform (red dashed line) and the RT-seislet transform (blue solid line) with respect to the noise level (variance value). |
|
|
|
|---|
|
sigmoid-noise0,rtseisrec-noise0
Figure 13. (a) Noisy data. (b) Reconstructed data using 10% coefficients (SNR=17.19). |
|
|
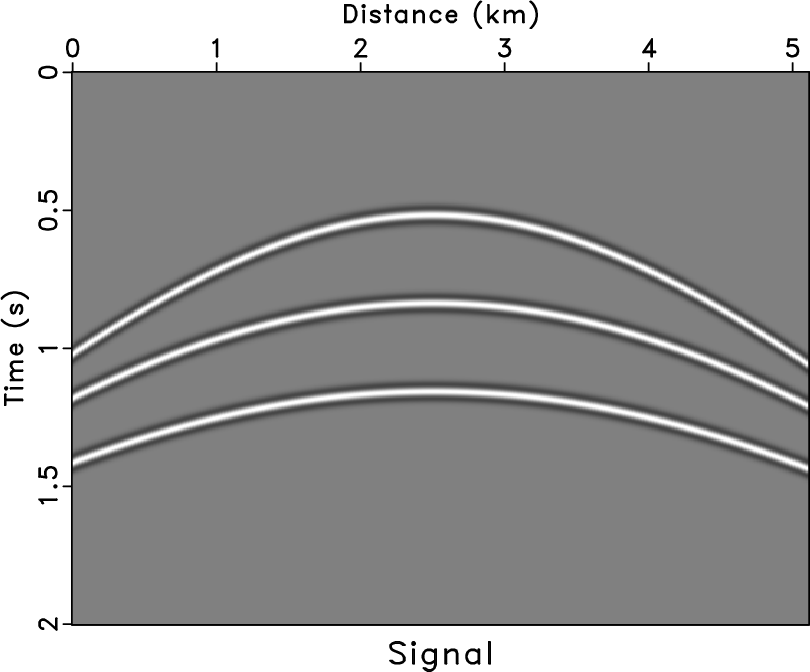
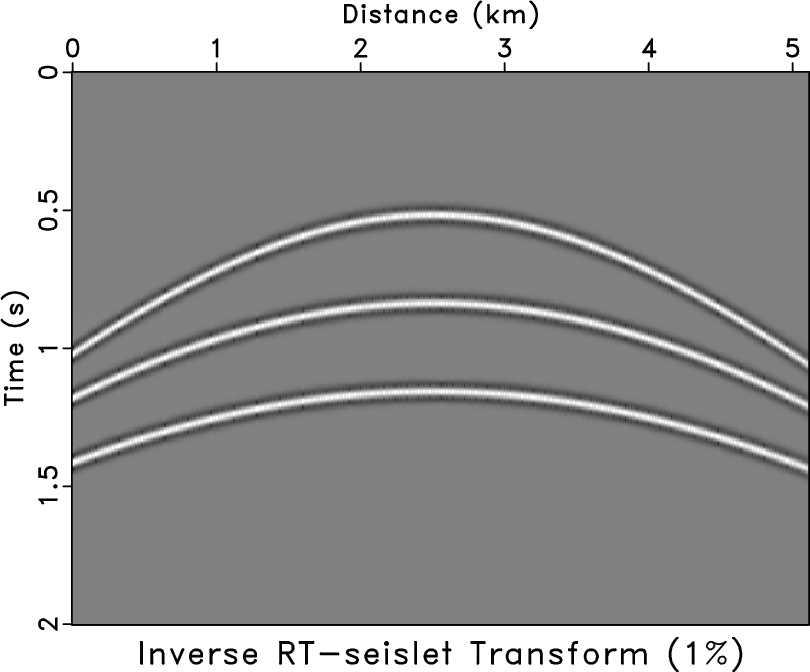
Figure 14 presents another synthetic example. Figure 14a and 14b shows the synthetic shot gather with three hyperbolic events and Figure 14b is the data reconstruction by the RT-seislet transform using only 1% of the most significant coefficients, respectively. We use the first, the middle and the last traces as the reference traces to compute the RT volume. The residual between the synthetic shot gather and the reconstruction result is shown in Figure 14c. For this simple synthetic shot gather, the proposed method achieves an excellent data reconstruction result.

|
|---|
|
para,para-rtseisrec1,para-diff
Figure 14. (a) Synthetic shot gather. (b) Data reconstruction by the inverse RT-seislet transform using only 1% of the most significant coefficients. (c) Difference between (a) and (b). |
|
|
|
|
|
|
Relative time seislet transform |