|
|
|
|
Investigating the possibility of locating microseismic sources using distributed sensor networks |
Next: Discussion and Conclusions Up: Numerical Examples Previous: Three-layer model
|
|
|
|
Investigating the possibility of locating microseismic sources using distributed sensor networks |
For the second example, we create a somewhat more realistic scenario by using a portion of the Marmousi velocity model (Versteeg, 1994). The model dimension is
 with a spatial sampling rate of
  along the vertical direction and
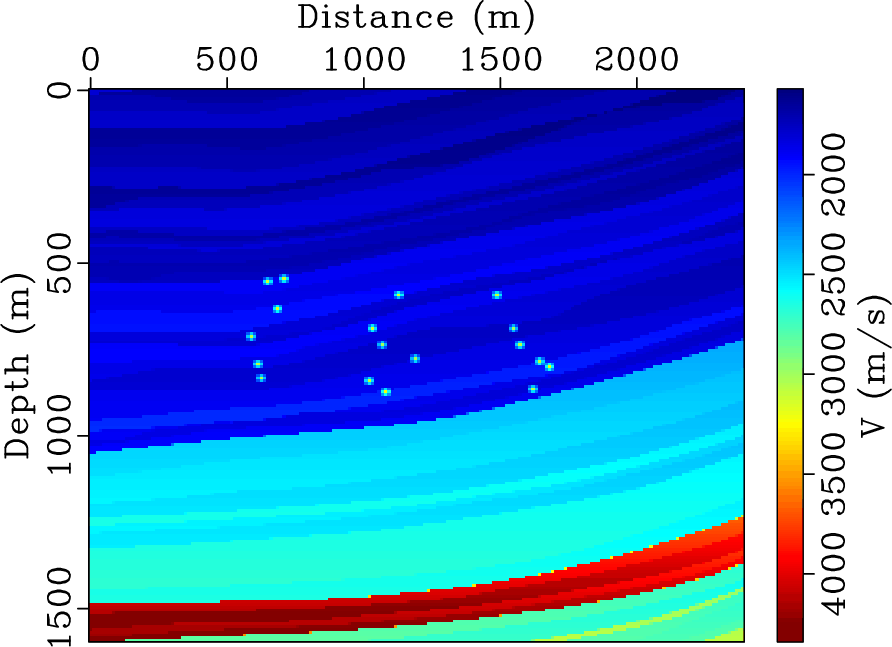
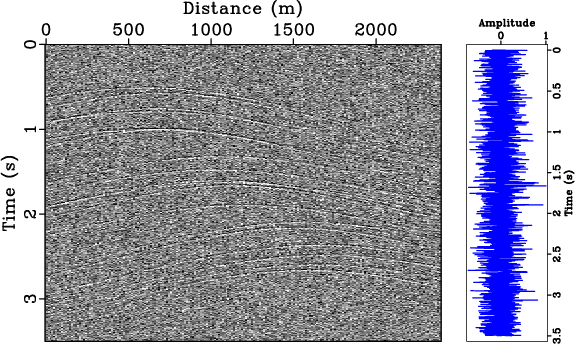
  along the horizontal direction. The model features a series of nearly parallel stratigraphic layers. To mimic an imaginary hydraulic fracturing process, we design three periods of assumed microseismicity propagating from left to right with a total of eighteen hypocenters, which corresponds to three stages of perforations (Figure 4). The data has a high level of random background noise (Figure 5). We employ the hybrid imaging condition using ten stations starting from
  with a spacing of
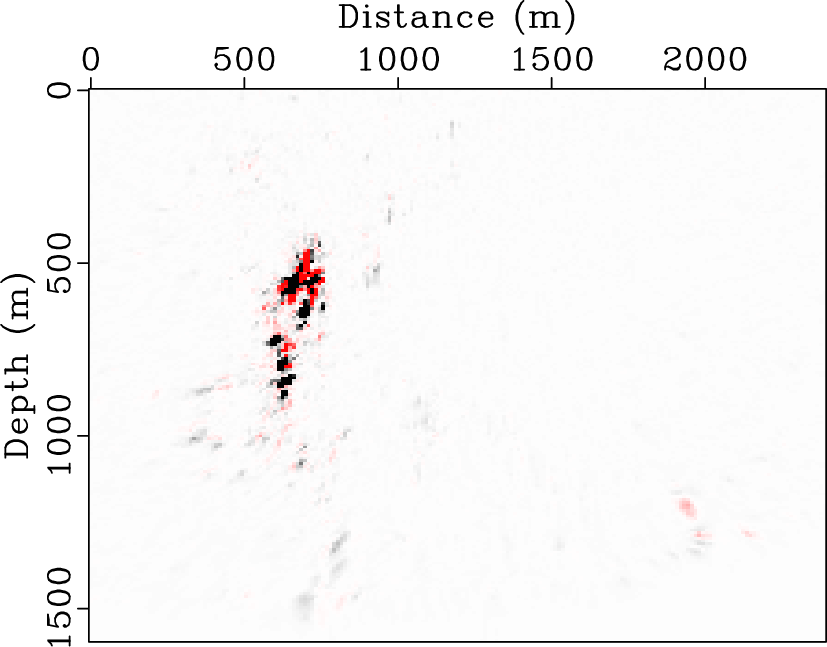
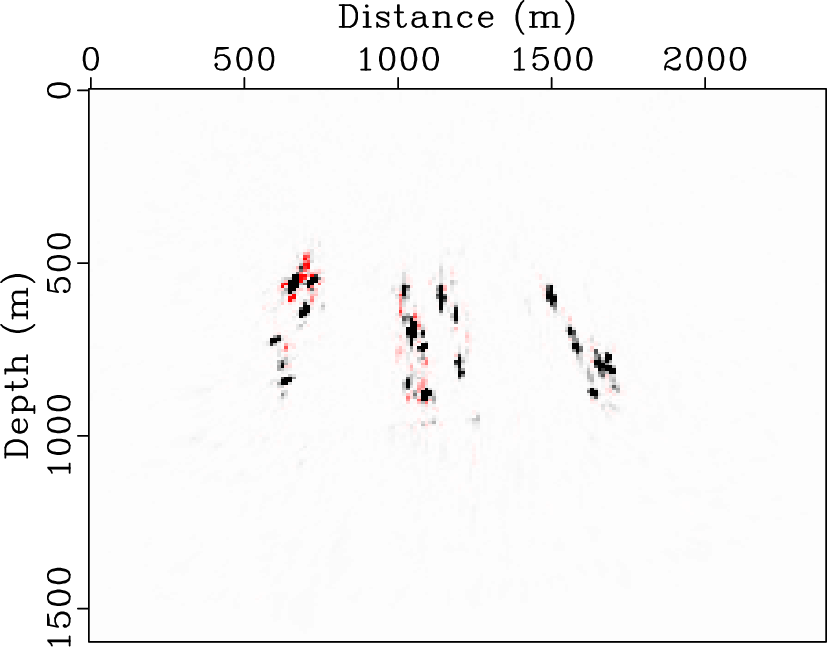
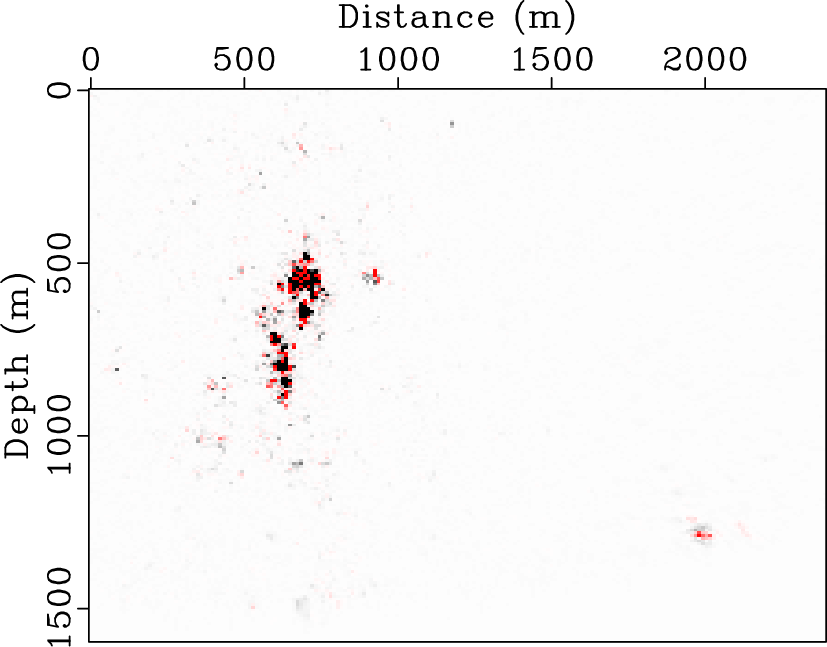
  . Each station is again comprised of five neighboring sensors with an interval of . The images computed from the surface array data accurately locates all the hypocenters, and evolve with time according to equation 4 (Figures 6a, 6b and 6c).
|
|---|
|
sov
Figure 4. Microseismic source locations overlaid on Marmousi velocity model. A total of three stages of microseismicity are assumed, each with six hypocenters. |
|
|
|
|---|
|
datatrace
Figure 5. Noisy microseismic data from Marmousi model. The trace in the right panel corresponds to  . .
|
|
|
So far we have been focusing on using data from surface arrays. Recently, there is a growing use of multiple monitoring configurations such as combining downhole arrays with surface sensors to provide better wavefield sampling (Maxwell, 2014). If available, data from downhole arrays/sensors can actually help improve the spatial resolution of imaged source locations, particularly in the vertical direction. In the last test, we combine data from the original surface arrays with data from four extra downhole sensors located at  and
and
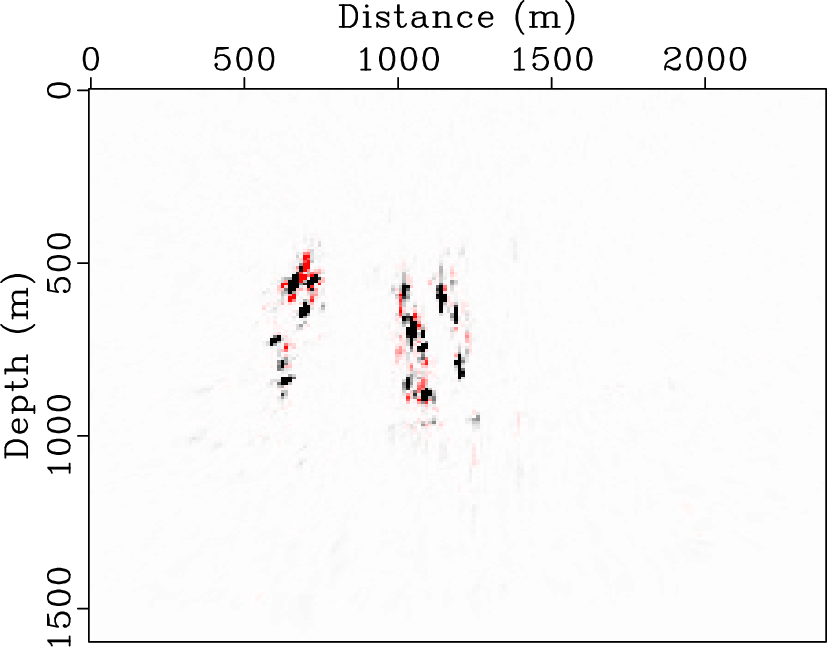
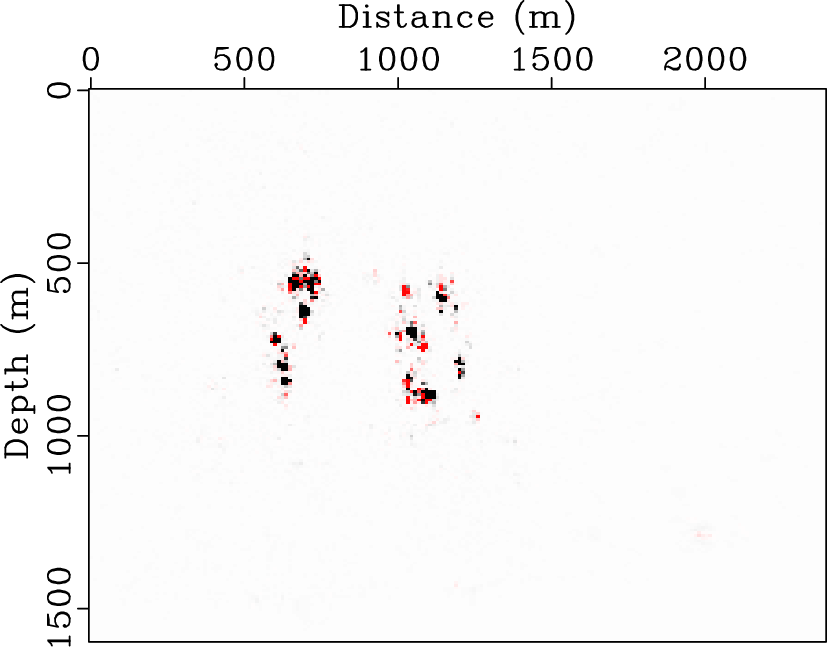
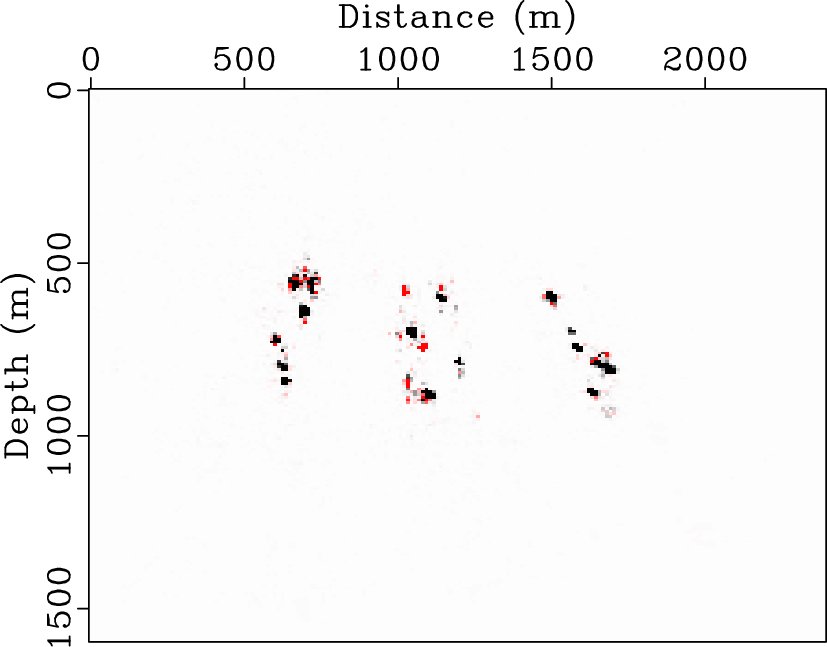
![$Z=[0.24\;km,\;0.64\;km,\;1.04\;km,\;1.44\;km]$](img25.png) respectively. The corresponding images demonstrate significantly higher vertical resolution thanks to the better sampling of the wavefield (Figures 6d, 6e and 6f). Our experiment confirms that combining surface and vertical borehole arrays can improve image resolution.
respectively. The corresponding images demonstrate significantly higher vertical resolution thanks to the better sampling of the wavefield (Figures 6d, 6e and 6f). Our experiment confirms that combining surface and vertical borehole arrays can improve image resolution.
|
|---|
|
stage0-1,stage0-2,stage0-3,stage-1,stage-2,stage-3
Figure 6. Accumulated microseismicity calculated by the hybrid imaging condition using: (a)-(c) noisy data from surface array; (d)-(f) noisy data from both surface array and downhole sensors. Each column is produced after one stage of perforation. |
|
|
|
|
|
|
Investigating the possibility of locating microseismic sources using distributed sensor networks |