|
|
|
|
Effects of lateral heterogeneity on time-domain processing parameters |
Next: Diffraction traveltime in multilayer Up: Reflection traveltime in multilayer Previous: Layered isotropic model with
|
|
|
|
Effects of lateral heterogeneity on time-domain processing parameters |
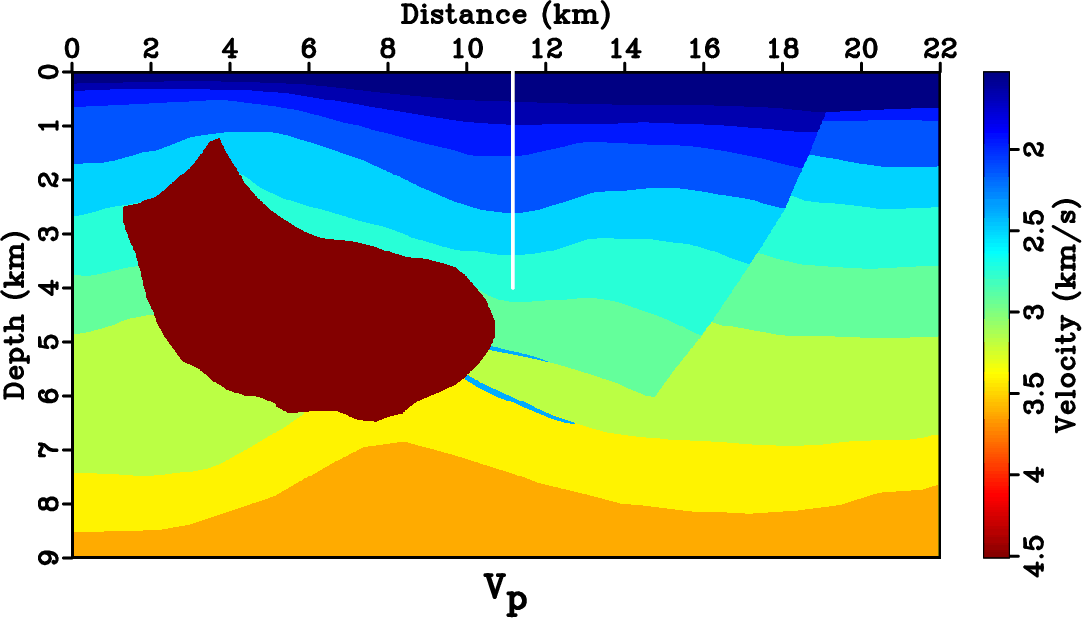
For the final example, we consider the Hess VTI model shown in Figure 7 and one of its raw CMP gathers at 11.17  . Due to the well-known limited applicability of time processing in geologically complex media, we only focus at the structure around this CMP gather. This choice allows us to test our approach in a realistic layered anisotropic model, while ensuring that time processing remains applicable. We focus on the effects of curved overburden layers related to the salt structure on reflection traveltime and the corresponding NMO velocity. In this model, the top two layers are isotropic, whereas the third and fourth layers are weakly anisotropic with
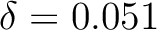 and 0.105, respectively. To ensure an agreement with the condition of offset-to-depth ratio smaller than unity, the offset range up to approximately 2.5 can be considered for the reflection from the bottom of the fourth layer.
|
|---|
|
vpline,deltaline
Figure 7. (a) Hess VTI model (a) Vertical P-wave velocity and (b) Thomsen's  with the considered CMP location indicated by the solid white line. with the considered CMP location indicated by the solid white line.
|
|
|
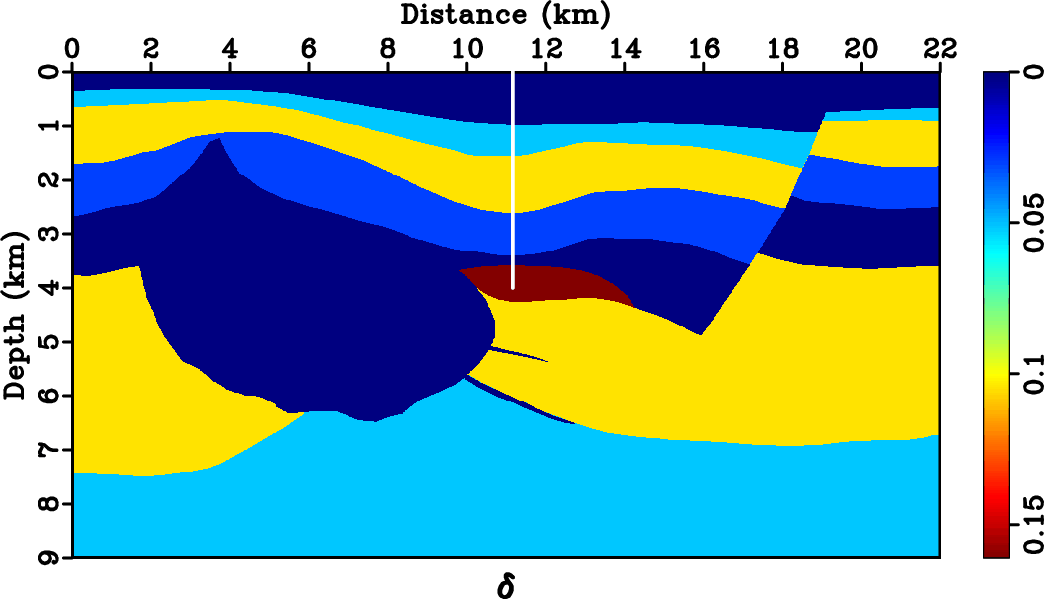
Figure 8 shows the CMP gather up to 4.8 offset range overlain by moveout approximations with NMO velocity computed based on the 1-D stratified medium assumption and from the proposed formula (equation 11). Focusing on the fourth reflection corresponding to the prominently curved interface, we can observe that the new effective NMO velocity from the proposed method can describe the true reflection traveltime with a higher noticeable accuracy in the range of the offset-to-depth ratio limit (up to 2.5 ). However, even though for this particular reflection from this model, the conclusion seems to also hold beyond 2.5 offset range, similar observation cannot be made for the third reflection event.
|
|---|
|
hypercomparehess3
Figure 8. An example raw CMP gather from the Hess VTI model at 11.17 . The solid lines correspond to regular moveout predictions based on the assumption of 1-D stratified model, whereas the dashed lines correspond to those from the proposed framework that takes into account the effects from heterogeneity. We can observe a better fitting from the latter.
|
|
|
|
|
|
|
Effects of lateral heterogeneity on time-domain processing parameters |