|
|
|
|
Seismic data interpolation using plane-wave shaping regularization |

|
|---|
|
qdome,hole,hole-shape
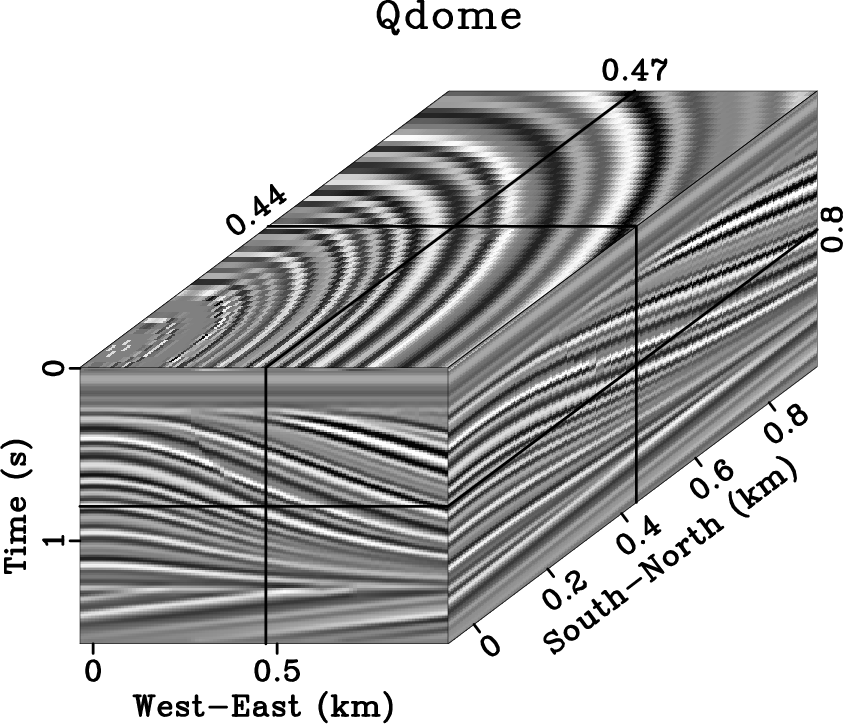
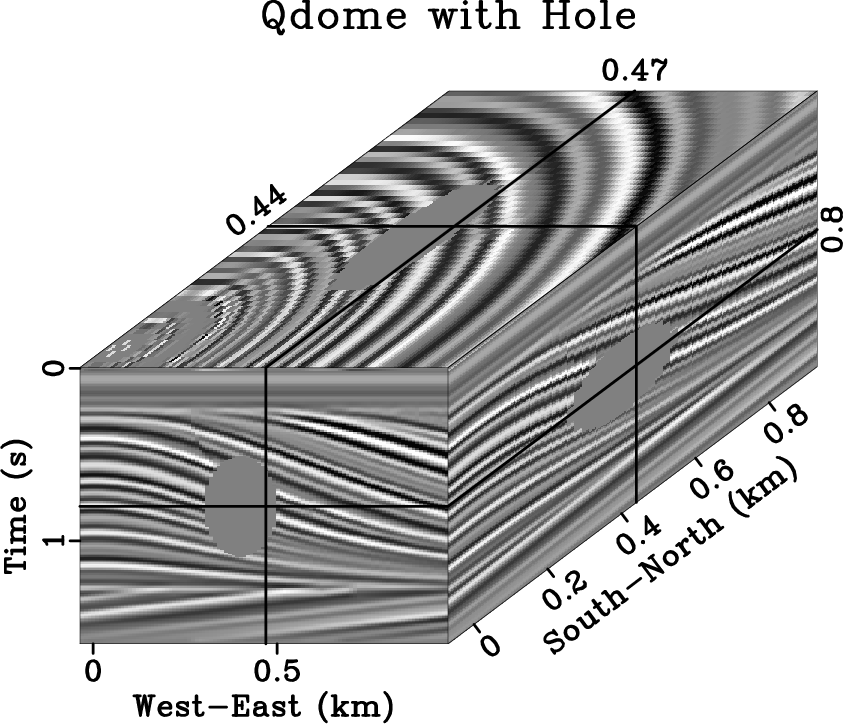
Figure 5. 3-D blind fill. The original qdome synthetic is shown in (a) and again in (b) with an ellipsoidal hole of missing data. The reconstruction using PWS is shown in (c). |
|
|
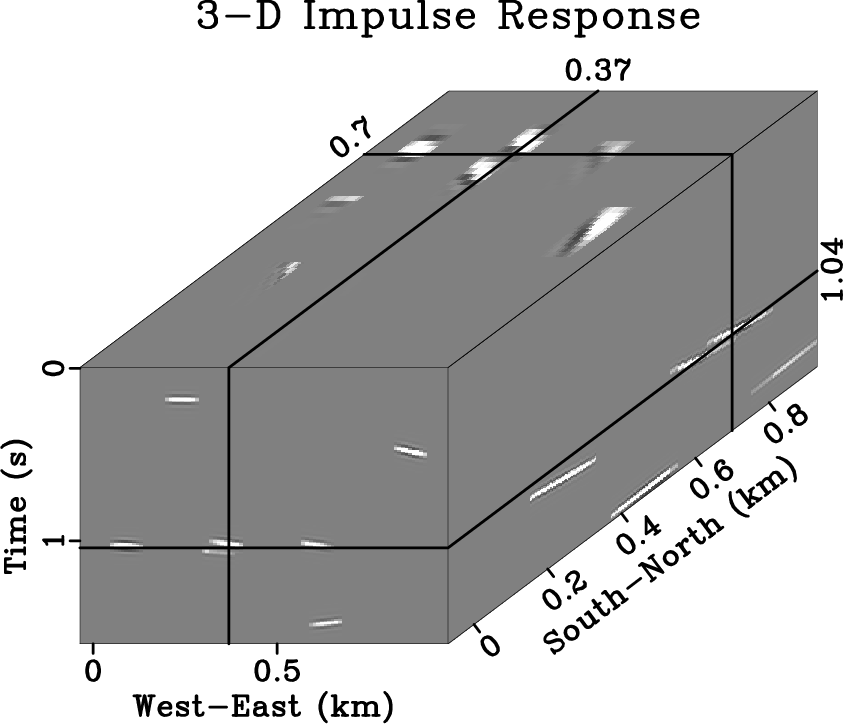
In this experiment, we use the 3-D version of the qdome seismic image and cut a large ellipsoidal hole in the data. Using only this information, we can see how well applying 3-D PWS is able to reconstruct the original data without knowing the full original dip field. By finding the local slope of the masked image, PWS interpolation can then be applied. The 3-D impulse response is tested in Figure 6 and shows the shaping of information to geologic structure in 3-D. Figure 5 shows the data (a) originally, (b) with the mask applied, and (c) with reconstruction. The resulting interpolation accurately patches the hole. The only area where the result mildly deviates from the answer is adjacent to the fault. Here, PWS smooths over the fault to make it somewhat more continuous. This effect can be neutralized by shrinking the smoothing radius to a more acceptable value.
|
|---|
|
pws3out-3d
Figure 6. 3-D impulse response. 20 spikes are randomly placed in the 3-D qdome model. These peaks are smeared in a structure-guided fashion by 3-D PWS to produce this image. |
|
|
|
|
|
|
Seismic data interpolation using plane-wave shaping regularization |