|
|
|
|
Seismic data interpolation using plane-wave shaping regularization |
|
|---|
|
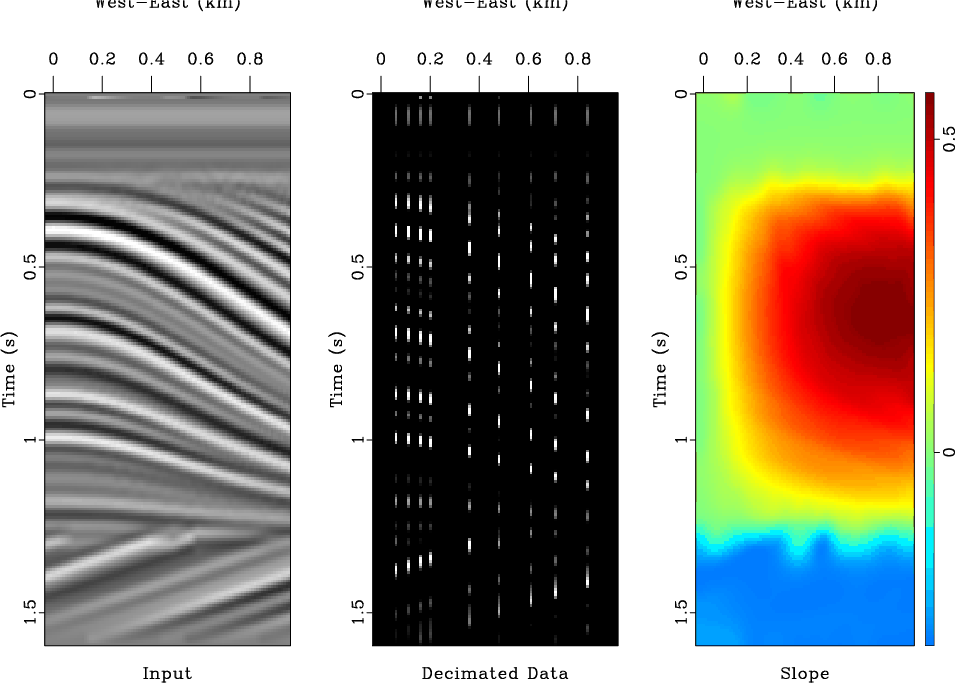
reflectors2
Figure 1. Synthetic example reproduced from Clapp et al. (2004). A 2-D slice of the quarterdome - qdome - synthetic seismic image is given in (a) from which (b) the decimated data - wells - and (c) the dip field are derived. The nine traces were preserved in the application of the mask to produce the wells, and (c) is found by taking the local slope. |
|
|

|
|---|
|
impulses
Figure 2. 2-D impulse response. 50 spikes are placed randomly through qdome and hit with the operators of (a) PWD, (b) PWC, and (c) PWS. |
|
|
|
|---|
|
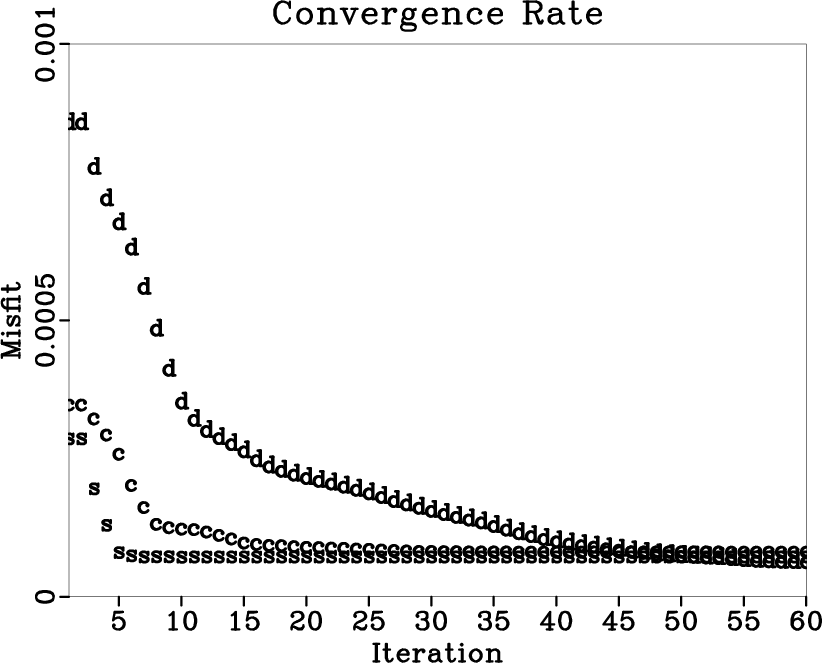
Matrix1Comparison
Figure 3. Convergence rate for 2-D synthetic example. This plot shows a comparison of the model error (2-norm) versus iteration number. The points denoted with "s" are derived from interpolation using PWS. The symbols "d" and "c" correspond to the same calculation using PWD and PWC respectively. |
|
|


|
|---|
|
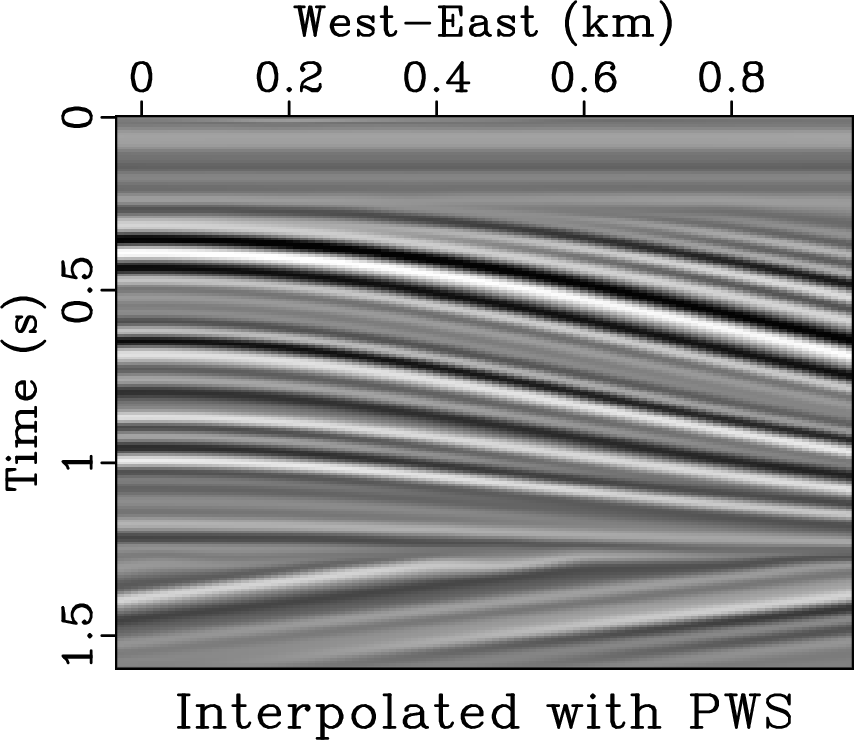
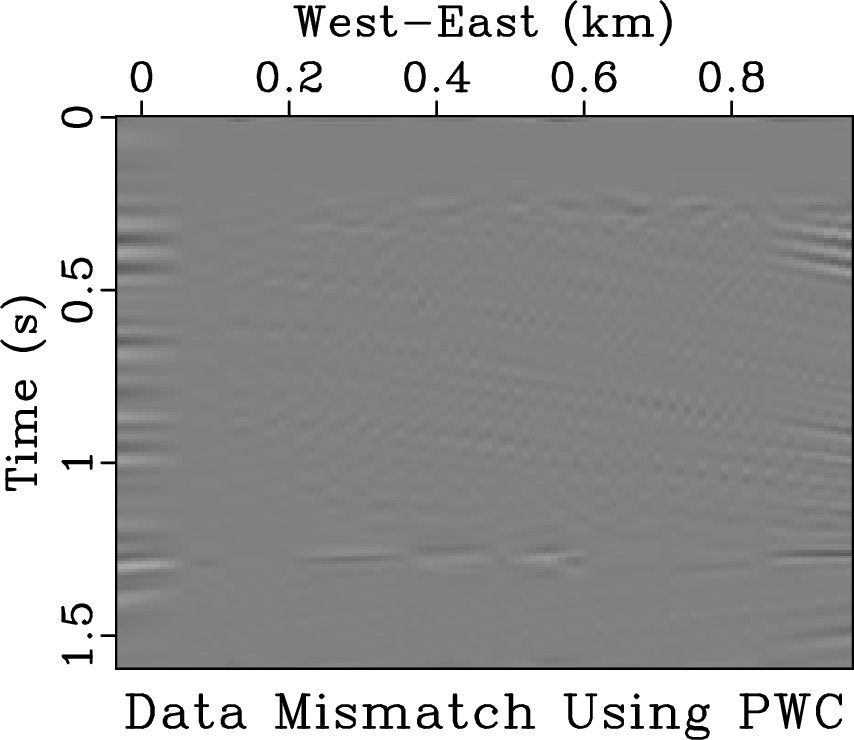
q-compa,q-compb,q-compc,q-compd,q-compe,q-compf
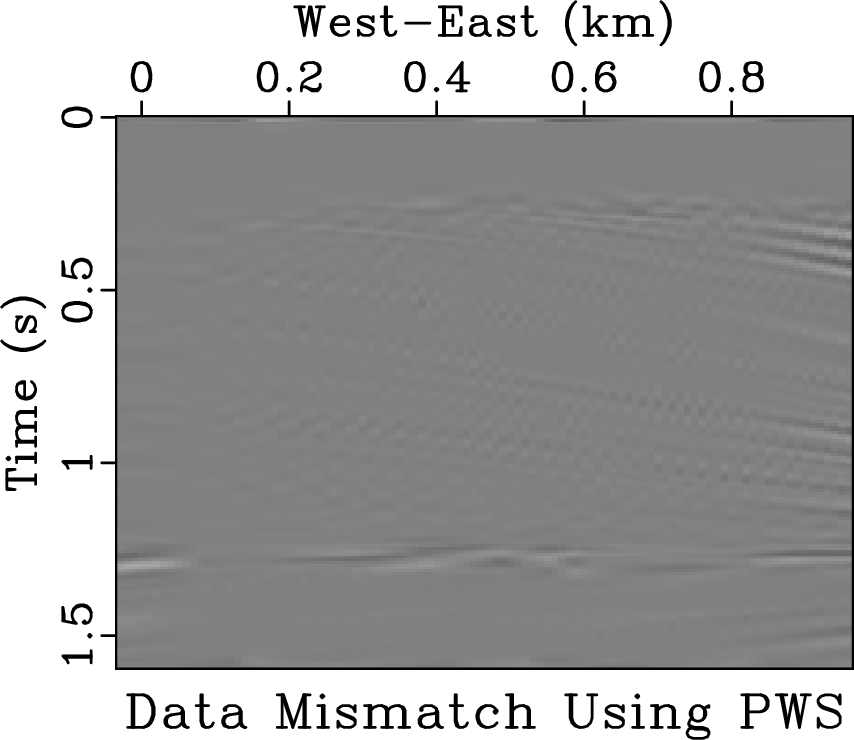
Figure 4. Reconstruction of 2-D synthetic data with interpolation from (a) plane-wave destruction, (b) plane-wave construction, and (c) plane-wave shaping. Parts (d), (e), and (f) correspond to the respective data misfit, computed with |
|
|
|
|
|
|
Seismic data interpolation using plane-wave shaping regularization |