next up previous [pdf]

Next: Conclusions Up: Interpolation Tests Previous: 3-D synthetic test

Field data test

The Parihaka data is a 3-D (full-angle stack, anisotropic, prestack time-migrated) seismic image from New Zealand provided for use by New Zealand Petroleum and Minerals. The data is shown in Figure 7a. Similar to the synthetic test, we mask the data, Figure 7b, and interpolate using PWS. The interpolation results are shown in Figure 7c with error section in 7d. The residual was sufficiently low after only 4 iterations. Because this scheme amounts to some quantity of smoothing, the fault that propagates clearly in the original seismic image is now smeared, but PWS continues to maintain the structural information of this fault's existence from the offset of beds.

pari-3d p3-deci2 p3-shfill2 p3-sherr2
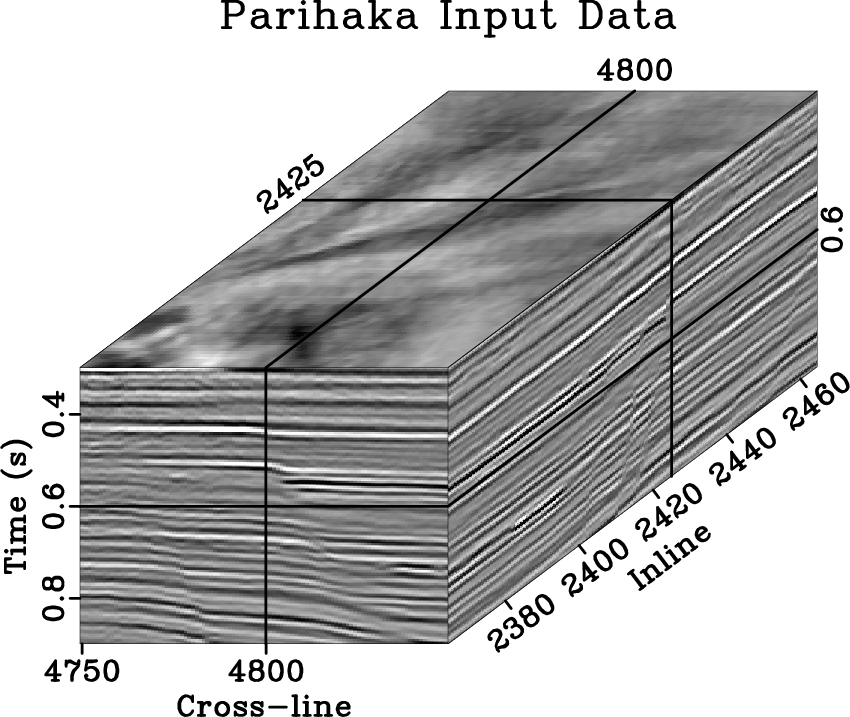
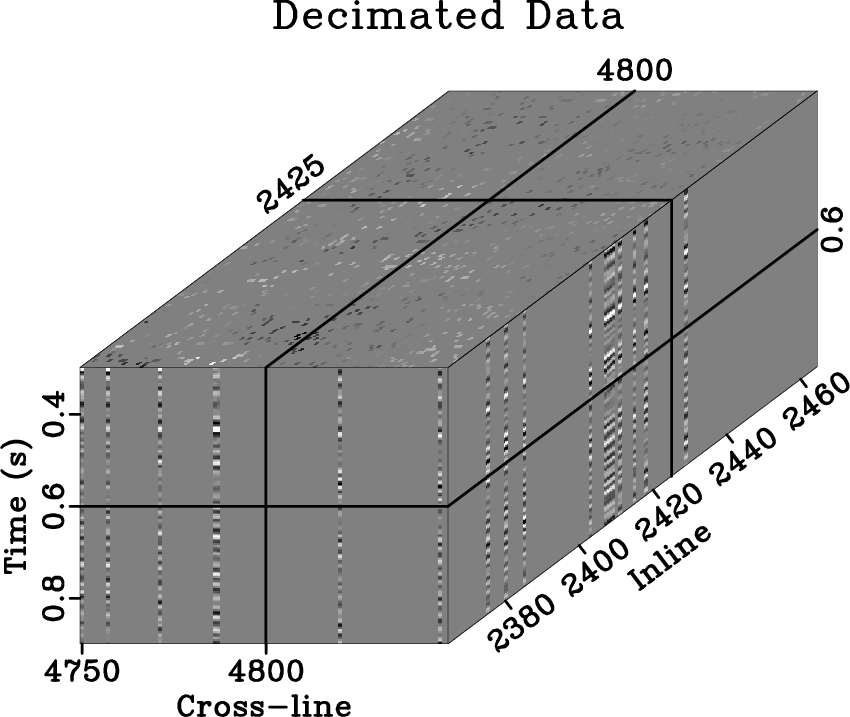
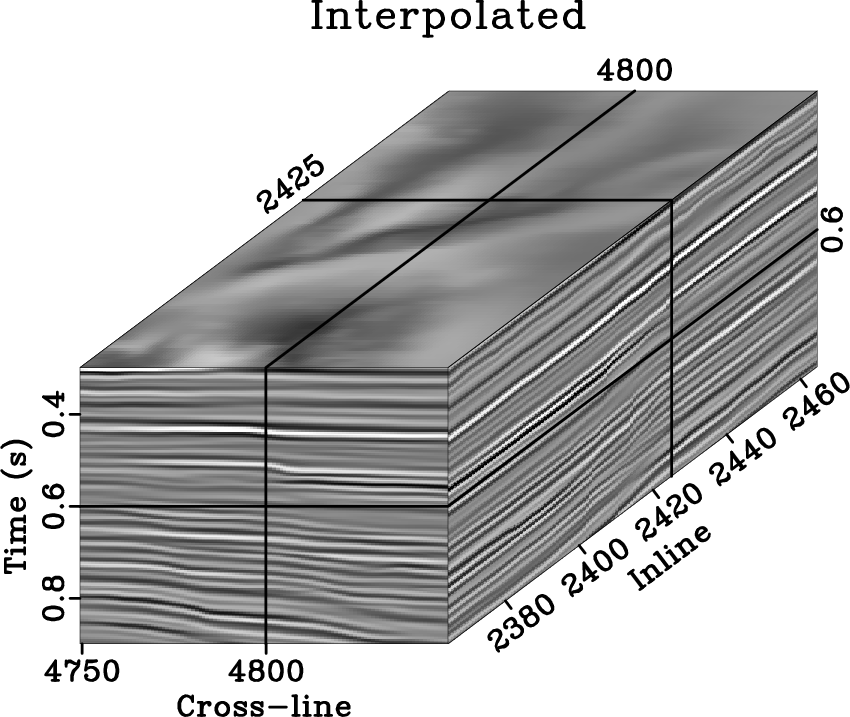
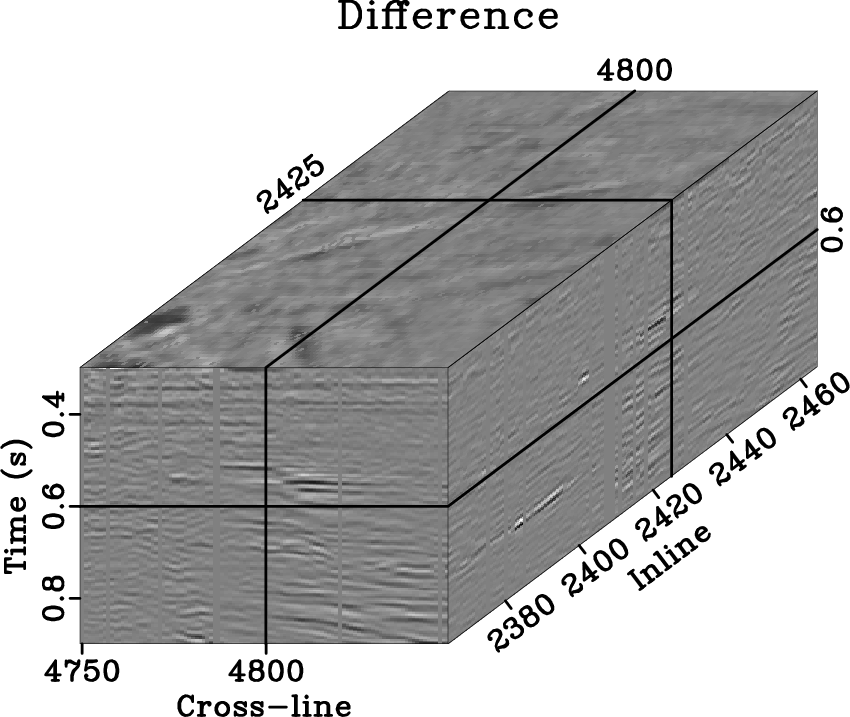
pari-3d,p3-deci2,p3-shfill2,p3-sherr2
Figure 7.
Real data interpolation example. The original data is depicted in (a) and a mask is applied to heavily decimate the input to create a set of wells (b). (c) shows the interpolated result of PWS, and (d) is the difference between the reconstruction and the original. The smallest-scale features and noise are removed as a result of the smoothing.
[pdf] [pdf] [pdf] [pdf] [png] [png] [png] [png] [scons]


next up previous [pdf]

Next: Conclusions Up: Interpolation Tests Previous: 3-D synthetic test

2022-08-02