|
|
|
|
Inverse B-spline interpolation |
Now that we have all the problem pieces together, we can test the performance gain in the inverse interpolation problem (19)-(25) from the application of B-splines.
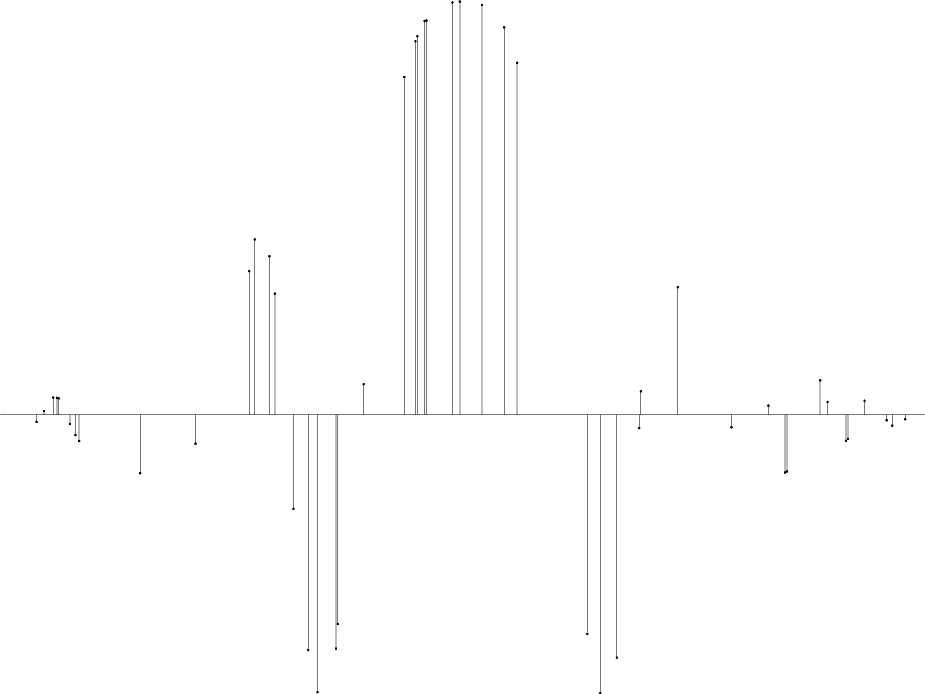
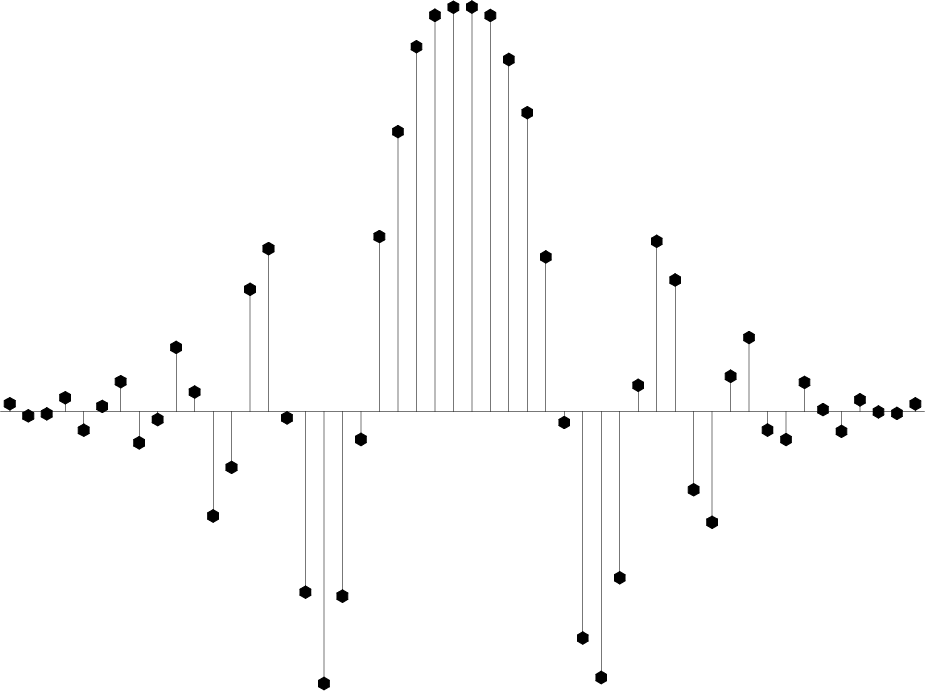
For a simple 1-D test, I chose the function shown in Figure 4, but sampled at irregular locations. To create two different regimes for the inverse interpolation problem, I chose 50 and 500 random locations. The two sets of points were interpolated to 500 and 50 regular samples respectively. The first test corresponds to an under-determined situation, while the second test is clearly over-determined. Figures 29 and 30 show the input data for the two test after normalized binning to the selected regular bins.
|
bin500
Figure 29. 50 random points binned to 500 regular grid points. The random data are used for testing inverse interpolation in an under-determined situation. |
|
|---|---|
|
|
|
bin50
Figure 30. 500 random points binned to 50 regular grid points. The random data are used for testing inverse interpolation in an over-determined situation. |
|
|---|---|
|
|
I solved system (19)-(25) by the iterative
conjugate-gradient method, utilizing a recursive filter
preconditioning (Fomel, 1997a) for faster convergence.
The regularization operator ![]() was constructed by using the
method of the previous subsection with the tension-spline differential
equation (Fomel, 2000b; Smith and Wessel, 1990) and the
tension parameter of
was constructed by using the
method of the previous subsection with the tension-spline differential
equation (Fomel, 2000b; Smith and Wessel, 1990) and the
tension parameter of ![]() .
.
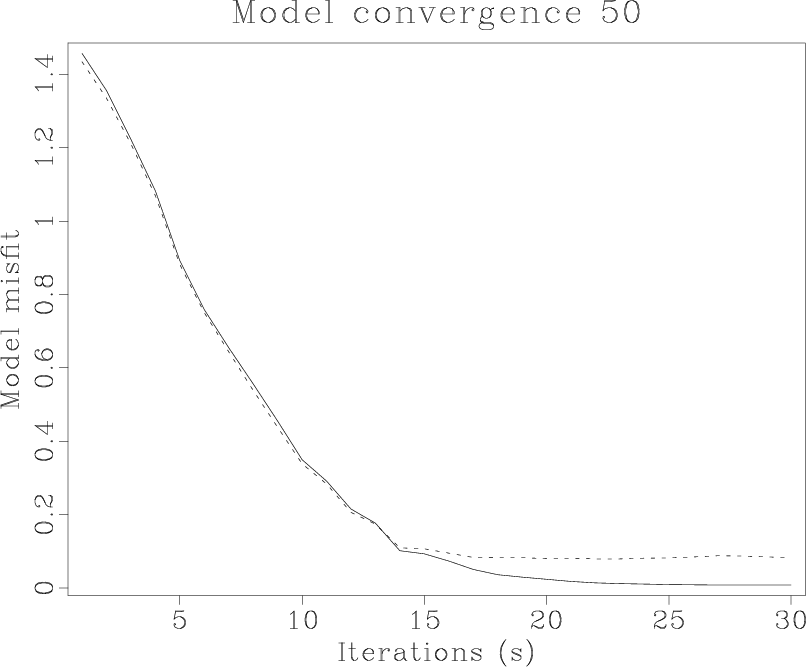
The least-squares differences between the true and the estimated model are plotted in Figures 31 and 32. Observing the behavior of the model misfit versus the number of iterations and comparing simple linear interpolation with the third-order B-spline interpolation, we discover that
|
norm500
Figure 31. Model convergence in the under-determined case. Dashed line: using linear interpolation. Solid line: using third-order B-spline. |

|
|---|---|
|
|
|
norm50
Figure 32. Model convergence in the over-determined case. Dashed line: using linear interpolation. Solid line: using third-order B-spline. |
|
|---|---|
|
|
|
|
|
|
Inverse B-spline interpolation |