|
|
|
|
Fractal heterogeneities in sonic logs and low-frequency scattering attenuation |
Waves propagating in disordered media are exponentially
attenuated by scattering (O'Doherty and Anstey, 1971; White et al., 1990).
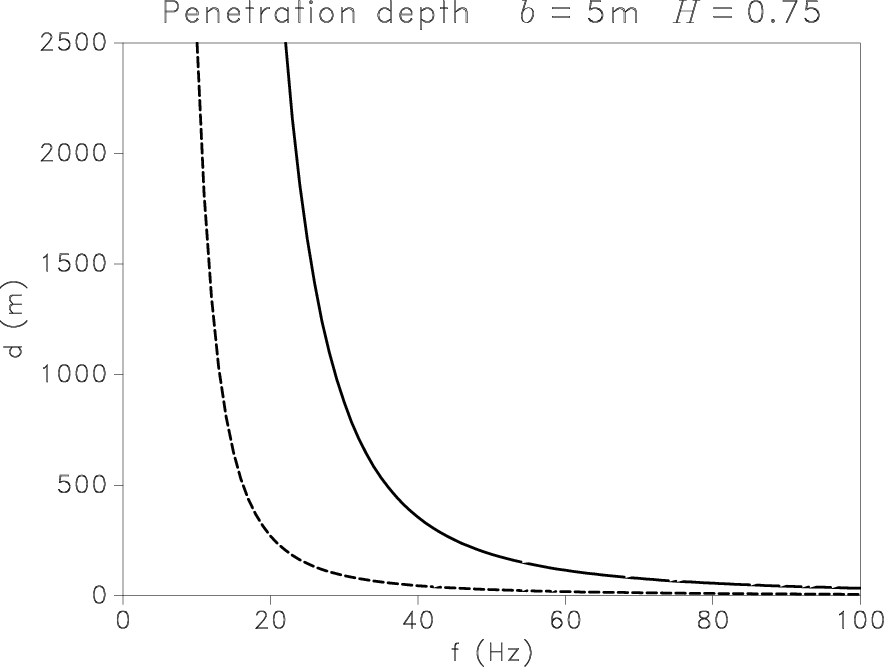
We define penetration depth ![]() to be the skin depth (van der Baan et al., 2007)
for low-frequency waves propagating in the heterogeneous medium:
to be the skin depth (van der Baan et al., 2007)
for low-frequency waves propagating in the heterogeneous medium:
|
|---|
|
depthlfb05M025,depthlfb25025,depthlfb05025,depthlfb10025,depthlfb05075,llqfb05025
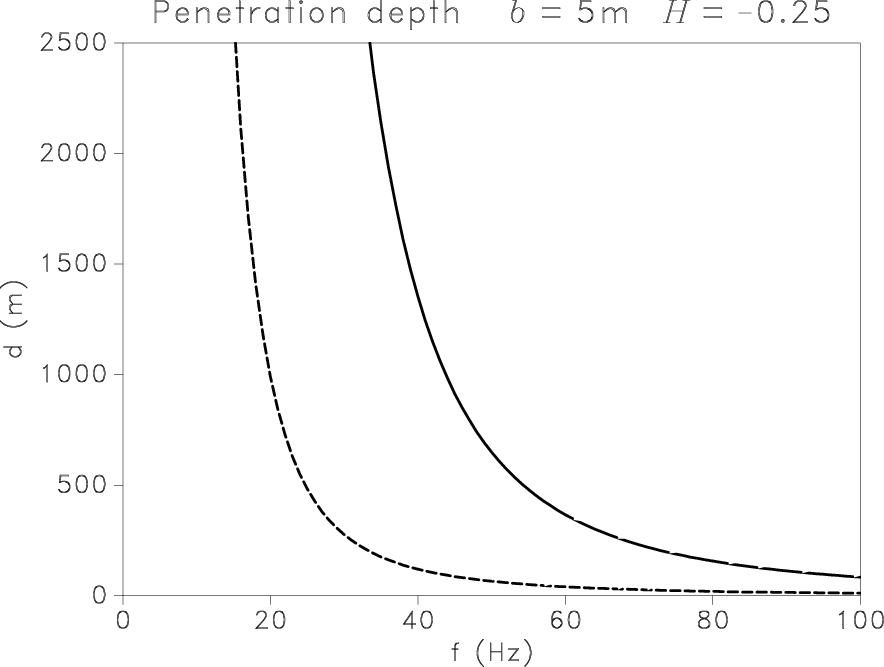
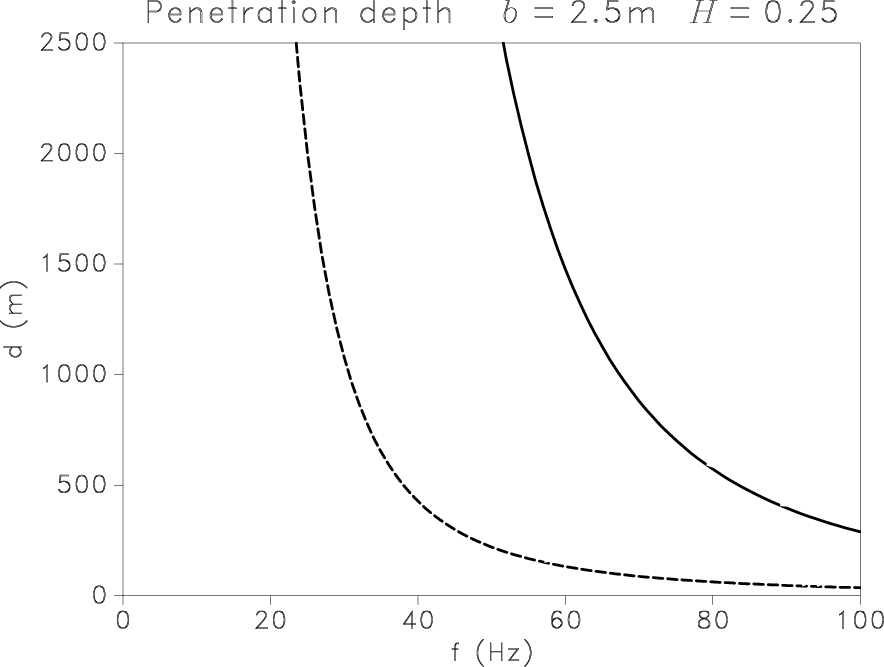
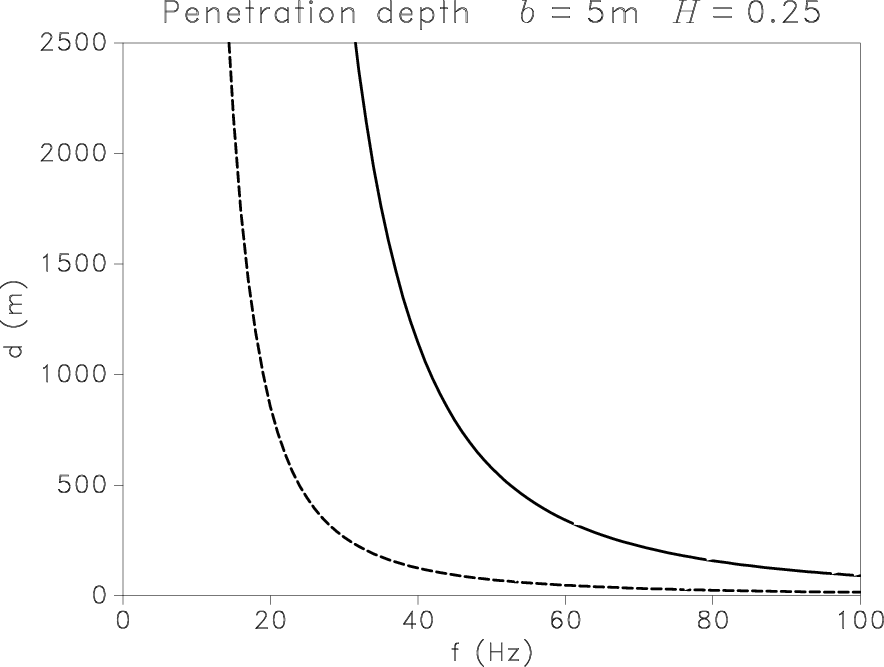
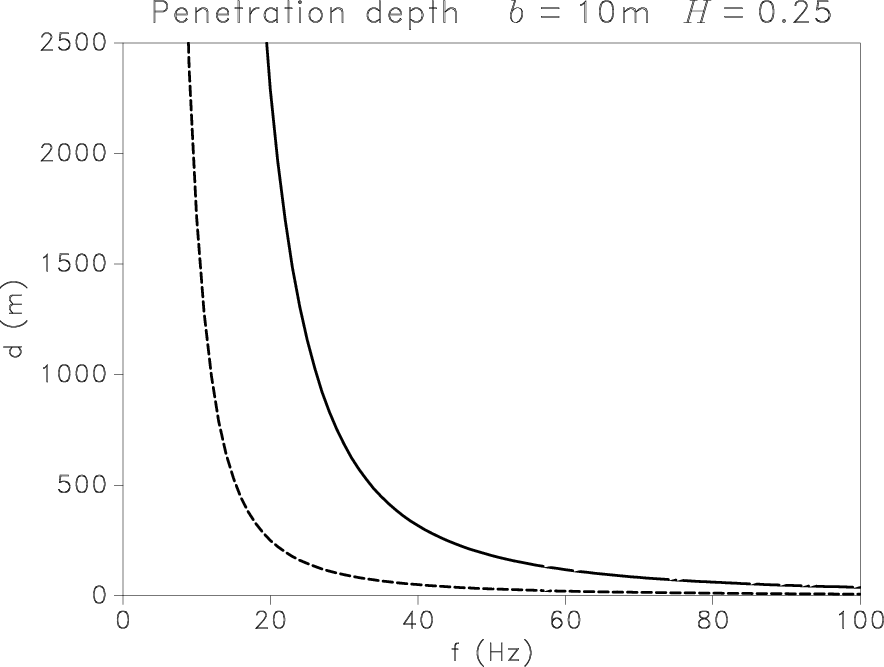
Figure 6. Penetration depth for P (solid) and S (dashed) scalar waves in heterogeneous media described by the von Kármán model with |
|
|
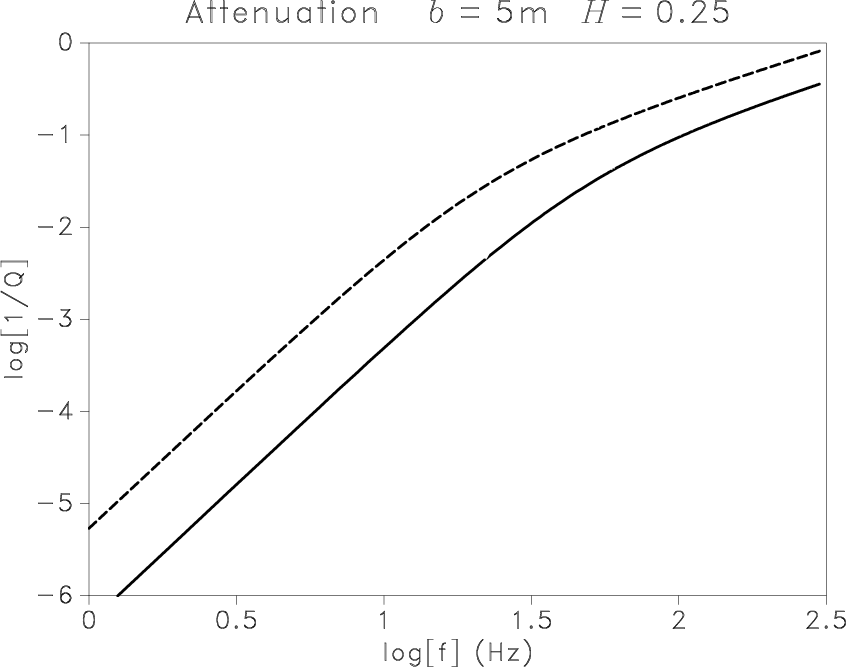
Scattering attenuation ![]() is proportional to
is proportional to ![]() at low frequencies and corresponds to the Rayleigh diffusion regime.
Attenuation increases at higher frequencies, where
at low frequencies and corresponds to the Rayleigh diffusion regime.
Attenuation increases at higher frequencies, where ![]() is proportional to
is proportional to ![]() and wavelength is comparable to the size of the heterogeneities.
Nevertheless, the validity of our scattering theory is constrained to
the low-frequency bandwidth until the attenuation curves in Figure 6(f)
reach the change of slope at 45 Hz for S-waves and 70 Hz for P-waves.
For a conventional seismic survey and for correlation length
and wavelength is comparable to the size of the heterogeneities.
Nevertheless, the validity of our scattering theory is constrained to
the low-frequency bandwidth until the attenuation curves in Figure 6(f)
reach the change of slope at 45 Hz for S-waves and 70 Hz for P-waves.
For a conventional seismic survey and for correlation length ![]() m, previously estimated,
wavelengths of P- and S-waves and ratio
m, previously estimated,
wavelengths of P- and S-waves and ratio ![]() are indicated in Table 5.
are indicated in Table 5.
| Wave | Frequency (Hz) | ||
| P | 10 | 270 | 54 |
| 90 | 30 | 6 | |
| S | 10 | 123 | 24 |
| 50 | 25 | 5 |
Scattering is more important for seismic wavelengths with a dimension
similar to that of heterogeneities: high frequencies and S-waves,
because their wavelengths are shorter than P-waves, are more
attenuated. Penetration depth is close to infinity at very low
frequencies but decreases drastically in a narrow frequency band,
depending on parameters ![]() and
and ![]() (see
Figure 6).
This steep descent shifts to higher frequencies when the fractal
exponent decreases, corresponding to a stronger cyclicity of the
layers. A shorter correlation length of heterogeneities highly
improves penetration of high frequencies for both types of wave (see
Figures 6(b) and 6(d)). For
large-size heterogeneities, i.e.
(see
Figure 6).
This steep descent shifts to higher frequencies when the fractal
exponent decreases, corresponding to a stronger cyclicity of the
layers. A shorter correlation length of heterogeneities highly
improves penetration of high frequencies for both types of wave (see
Figures 6(b) and 6(d)). For
large-size heterogeneities, i.e. ![]() m, the scattering theory we
use is not valid because the seismic frequencies statisfy
m, the scattering theory we
use is not valid because the seismic frequencies statisfy ![]() . Scattering regimes and the suggested description of
heterogeneities are summarized in Figure 7. Our
results therefore ignore the effects of large cycles in sediments. We
refer the reader to Stovas and Ursin (2007) for more information on the
effects of cycles on wave progagation.
. Scattering regimes and the suggested description of
heterogeneities are summarized in Figure 7. Our
results therefore ignore the effects of large cycles in sediments. We
refer the reader to Stovas and Ursin (2007) for more information on the
effects of cycles on wave progagation.

|
|---|
|
schemeshetb
Figure 7. Schematic representation, including the suggested description of heterogeneities, of the different scattering regimes depending on the ratio between the seismic wavelength |
|
|
|
|
|
|
Fractal heterogeneities in sonic logs and low-frequency scattering attenuation |
![$\displaystyle \frac{k_0}{2Q} = Im[k]\,,$](img199.png)
![$\displaystyle \frac{b~(1+4\,b^2k_0^2)^{H+\frac{1}{2}}}
{\sigma^2\,(k_0b)^2\,C^{(1)}_{H}\left[(1+4\,b^2k_0^2)^{H+\frac{1}{2}}-1\right]}\,,$](img201.png)