|
|
|
|
Seismic data interpolation beyond aliasing using regularized nonstationary autoregression |
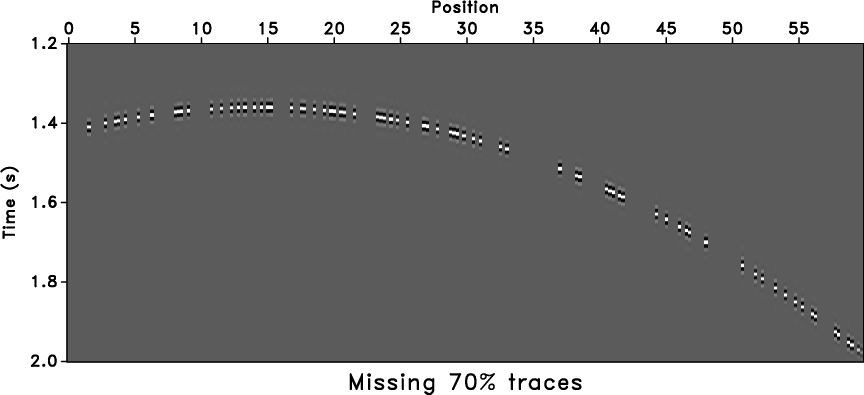
A missing trace test is shown in Figure 4a and
comes from decimated-trace interpolation result
(Figure 2c) after removing 70% of
randomly selected traces. The curved event makes it difficult to
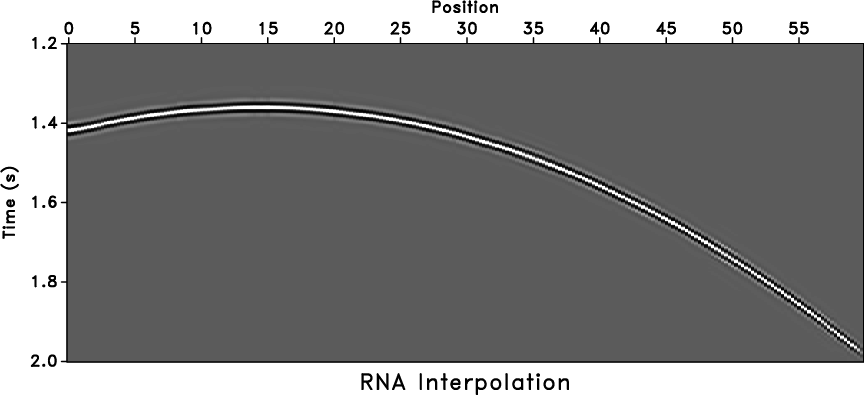
recover the missing traces. The interpolated result is shown in
Figure 4b, which uses a regularized adaptive PEF
with 4 (time) ![]() 2 (space) coefficients for each sample and a
50-sample (time)
2 (space) coefficients for each sample and a
50-sample (time) ![]() 10-sample (space) smoothing radius. In the
interpolated result, it is visually difficult to distinguish the
missing trace locations, which is an evidence of successful
interpolation. The filter size along space direction needs to be
small in order to generate enough regression equations.
10-sample (space) smoothing radius. In the
interpolated result, it is visually difficult to distinguish the
missing trace locations, which is an evidence of successful
interpolation. The filter size along space direction needs to be
small in order to generate enough regression equations.
|
|---|
|
zero,jamiss
Figure 4. Curved model (Figure 2c) with 70% randomly selected traces removed (a) and trace interpolation with regularized nonstationary autoregression (b). |
|
|
|
|
|
|
Seismic data interpolation beyond aliasing using regularized nonstationary autoregression |