|
|
|
|
Seismic data interpolation using streaming prediction filter in the frequency domain |
We generated a 2D synthetic model with one linear event and two curve
events to evaluate the interpolation ability of the ![]() -
-![]() SPF. The
curve events bend in opposite directions (Fig. 3a
and 3b), which challenges the adaptability of
interpolation method. For a missing trace interpolation test
(Fig. 3c), we removed
SPF. The
curve events bend in opposite directions (Fig. 3a
and 3b), which challenges the adaptability of
interpolation method. For a missing trace interpolation test
(Fig. 3c), we removed ![]() of the randomly selected
traces, which caused the appearance of aliasing
(Fig. 3d). For comparison, we used the 2D Fourier
Project Onto Convex Sets (POCS) to recover the missing traces
(Fig. 4a). The interpolation result from the 2D Fourier
POCS showed that the linear event was interpolated, but many
discontinuities were present on the curve events. The interpolated
error was slightly larger in the locations missing traces
(Fig. 4b), which is caused by strongly variable slopes.
The seislet POCS method (Gan et al., 2016) shows a clean interpolation
result (Fig. 4c), but it produces interpolation errors
where the events intersect (Fig. 4d). We designed
the
of the randomly selected
traces, which caused the appearance of aliasing
(Fig. 3d). For comparison, we used the 2D Fourier
Project Onto Convex Sets (POCS) to recover the missing traces
(Fig. 4a). The interpolation result from the 2D Fourier
POCS showed that the linear event was interpolated, but many
discontinuities were present on the curve events. The interpolated
error was slightly larger in the locations missing traces
(Fig. 4b), which is caused by strongly variable slopes.
The seislet POCS method (Gan et al., 2016) shows a clean interpolation
result (Fig. 4c), but it produces interpolation errors
where the events intersect (Fig. 4d). We designed
the ![]() -
-![]() SPF with
SPF with
![]() ,
,
![]() , and 30
(space) filter coefficients. The proposed method provided successful
amplitude preservation, and the missing traces were interpolated
reasonably well (Fig. 4e). The difference between the
interpolated and original traces showed that most of the redundant
fluctuations and artifacts were smaller than those created by the
Fourier POCS (Fig. 4f). The
, and 30
(space) filter coefficients. The proposed method provided successful
amplitude preservation, and the missing traces were interpolated
reasonably well (Fig. 4e). The difference between the
interpolated and original traces showed that most of the redundant
fluctuations and artifacts were smaller than those created by the
Fourier POCS (Fig. 4f). The ![]() -
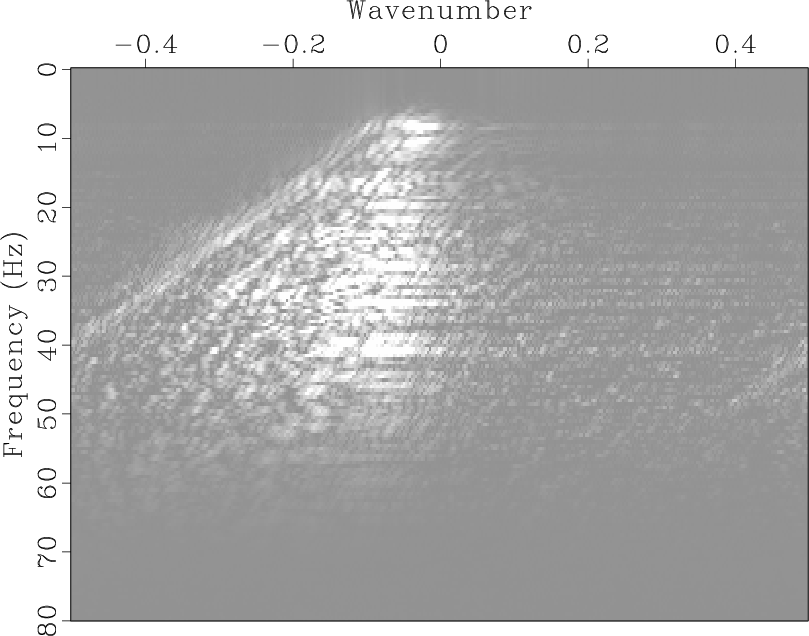
-![]() spectra
(Fig. 5) showed that the
spectra
(Fig. 5) showed that the ![]() -
-![]() SPF
recovered the missing data and successfully suppressed aliasing.
SPF
recovered the missing data and successfully suppressed aliasing.


|
|---|
|
mod,fkmod,gap,fkgap
Figure 3. Synthetic model (a) and |
|
|


|
|---|
|
pocs,errpocs,stpocs,errstpocs,fxspf,errfxspf
Figure 4. Reconstructed result (a) and interpolation error (b) using the 2D Fourier POCS, reconstructed result (c) and interpolation error (d) using the 2D seislet POCS, reconstructed result (e) and interpolation error (f) using the 2D |
|
|


|
|---|
|
fkpocs,fkstpocs,fkfxspf
Figure 5. |
|
|
Fig. 6a shows a marine shot gather from a deepwater Gulf
of Mexico survey with ![]() of the data traces randomly removed
(Fig. 6c). The
of the data traces randomly removed
(Fig. 6c). The ![]() -
-![]() spectra (Fig. 6b
and 6d) reflect the impact caused by missing data.
Fig. 7a shows the interpolated result using the 2D
Fourier POCS, which fails to recover steeply dipping events at the
far-offset positions (Fig. 7b). In the interpolation
result of seislet POCS, discontinuities of seismic events are present
(Fig. 7c), and some energy remains in the
interpolation error profile (Fig. 7d). We designed
the
spectra (Fig. 6b
and 6d) reflect the impact caused by missing data.
Fig. 7a shows the interpolated result using the 2D
Fourier POCS, which fails to recover steeply dipping events at the
far-offset positions (Fig. 7b). In the interpolation
result of seislet POCS, discontinuities of seismic events are present
(Fig. 7c), and some energy remains in the
interpolation error profile (Fig. 7d). We designed
the ![]() -
-![]() SPF with
SPF with
![]() ,
,
![]() , and 20
(space) coefficients. Fig. 7e and 7f
show the interpolated result using the proposed method and the
difference between the interpolated and original traces plotted at the
same clip value. The reconstructed data naturally filled the broken
events; meanwhile, the steeply dipping events and diffraction events
were reasonably interpolated. The
, and 20
(space) coefficients. Fig. 7e and 7f
show the interpolated result using the proposed method and the
difference between the interpolated and original traces plotted at the
same clip value. The reconstructed data naturally filled the broken
events; meanwhile, the steeply dipping events and diffraction events
were reasonably interpolated. The ![]() -
-![]() spectrum of the
interpolation result using the
spectrum of the
interpolation result using the ![]() -
-![]() SPF (Fig. 8c)
is similar to that of the original data (Fig. 6b); it
suppresses the low-frequency interference compared to the seislet POCS
(Fig. 8b), and gives a cleaner spectrum than the
Fourier POCS (Fig. 8a).
SPF (Fig. 8c)
is similar to that of the original data (Fig. 6b); it
suppresses the low-frequency interference compared to the seislet POCS
(Fig. 8b), and gives a cleaner spectrum than the
Fourier POCS (Fig. 8a).


|
|---|
|
sean,fksn,gapsn,fkgapsn
Figure 6. Field data (a) and |
|
|


|
|---|
|
pocssn,errpocssn,stpocssn,errstpocssn,fxspfsn,errfxspfsn
Figure 7. Reconstructed result (a) and interpolation error (b) using the 2D Fourier POCS, reconstructed result (c) and interpolation error (d) using the 2D seislet POCS, reconstructed result (e) and interpolation error (f) using the 2D |
|
|


|
|---|
|
fkpocssn,fkstpocssn,fkfxspfsn
Figure 8. |
|
|
|
|
|
|
Seismic data interpolation using streaming prediction filter in the frequency domain |