next up previous [pdf]

Next: Gulf of Mexico field Up: Examples Previous: Linear-gradient model

Nankai field data example

To test the algorithm with field data, we first start with the Nankai data set (Forel et al., 2005). We preprocessed the data set to correct for uneven bathymetry, ground roll attenuation and surface consistent amplitude correction. In order to obtain the migration velocity, we use Fowler (1984) dip moveout. The resultant migration velocity in Figure 5b is used to perform Kirchhoff time migration in Figure 5c of the stacked section in Figure 5a. Next, we convert the migration velocity to the Dix velocity in Figure 6a and subsequently use it for wave-equation time migration in Figure 6b. Zoomed in sections of the conventional time migration and wave-equation time migration (Figure 7) show that the image obtained by wave-equation time migration is correctly focused near the water column with faults and subduction zone migrated to their true subsurface locations whereas time migration fails to focus the image accurately because of the strong lateral velocity variations. The image obtained by wave-equation time migration is still in time coordinates. We transform it to depth coordinates using the fast time-to-depth conversion algorithm (Sripanich and Fomel, 2018). Figure 8 shows Dix-inverted migration velocity squared $w_{dr}(x,z)$ and its gradients evaluated in the time-domain coordinates that are used to compute the interval velocity by fast time to depth algorithm along with the image ray coordinate system as shown in Figure 9a and 9b respectively. Applying time-to-depth conversion to image obtained after 
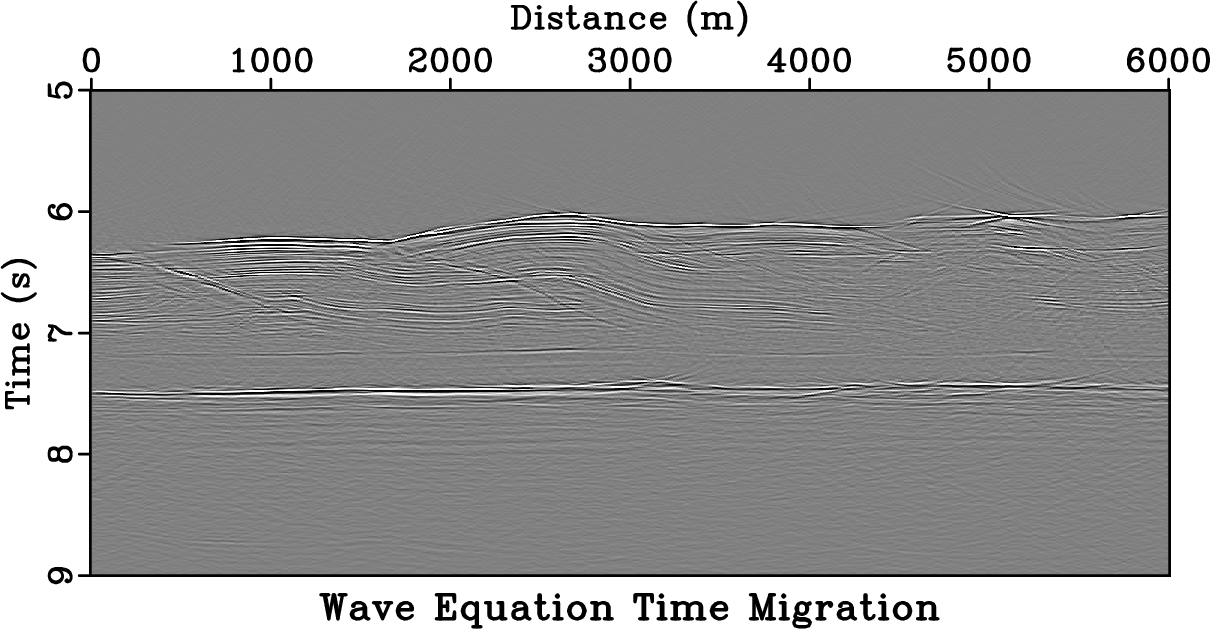
Wave-equation time migration in Figure 10a and comparing it with depth migrated image in Figure 10b (obtained using estimated interval velocity with time-to depth conversion from Dix velocity models) we see that results are comparable and that the wave-equation time migration image is both correctly focused and correctly positioned in depth.

slice vpickk kpstm2
slice,vpickk,kpstm2
Figure 5.
(a) Stacked section for Nankai field data. (b) Time-migration velocity, and (c) Image obtained by Kirchhoff time migration.
[pdf] [pdf] [pdf] [png] [png] [png] [scons]

veltestw wetmnan
veltestw,wetmnan
Figure 6.
(a) Dix velocity, and (b) Image obtained by wave-equation time migration using RTM in image-ray coordinates.
[pdf] [pdf] [png] [png] [scons]

zoom zoom2
zoom,zoom2
Figure 7.
Zoomed in portion (a) Stacked section (b) Conventional time migration and (c) wave-equation time migration shows that water layer is correctly focused and faults are delineated more clearly and are migrated to their true subsurface position with our proposed method as compared to the conventional time migration.
[pdf] [pdf] [png] [png] [scons]

refdix alpha beta
refdix,alpha,beta
Figure 8.
The inputs for time to depth conversion of velocities for the Nankai field data example: Dix velocity squared $w_{dr}$ and its gradients.
[pdf] [pdf] [pdf] [png] [png] [png] [scons]

finalv imageraysnan
finalv,imageraysnan
Figure 9.
(a) The estimated interval $w(x,z)$ using fast time to depth conversion algorithm for the Nankai field data example. (b) Image rays (curves of constant $x_0$) and wavefronts (curves of constant $t_0$).
[pdf] [pdf] [png] [png] [scons]

finalmapd rtmsf
finalmapd,rtmsf
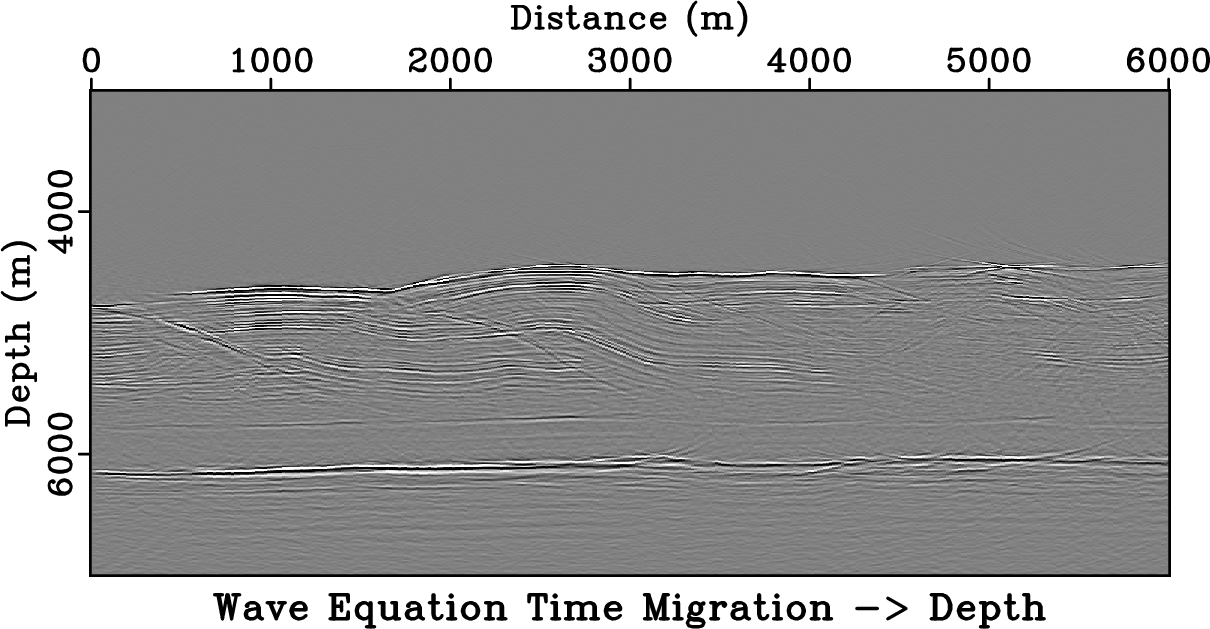
Figure 10.
(a) Image obtained using wave-equation time migration after conversion to Cartesian coordinates. (b) Image obtained using depth migration using RTM in Cartesian coordinates.
[pdf] [pdf] [png] [png] [scons]


next up previous [pdf]

Next: Gulf of Mexico field Up: Examples Previous: Linear-gradient model

2022-05-23