Matplotlib is a popular Python library for 2D plotting, which emulates (and exceeds) the plotting functionality of MATLAB.
At the Madagascar Working Workshop in 2018, a couple of new scripts were added to simplify plotting with Matplotlib in Madagascar.
- sfmatplotlib can be used to plot RSF files.You can use it as follows:
Without the standard output, the figure is displayed on the screen.
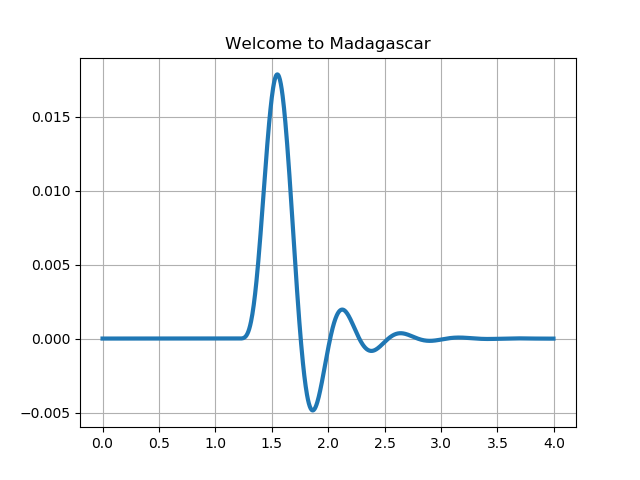
The figure above was generated with
sfspike n1=1000 k1=300 | sfbandpass fhi=2 phase=y| sfmatplotlib plot title="Welcome to Maagascar" grid=y linewidth=3 format=png > figure.pngFuther enhancements are possible.
- sfpgreywfl is a script contributed by Carlos da Costa that uses matplotlib for plotting a seismic wavefiels overlaid on the velocity model.

The figure above was generated with