Next: Visualizing plots
Up: Plotting
Previous: VPLOT
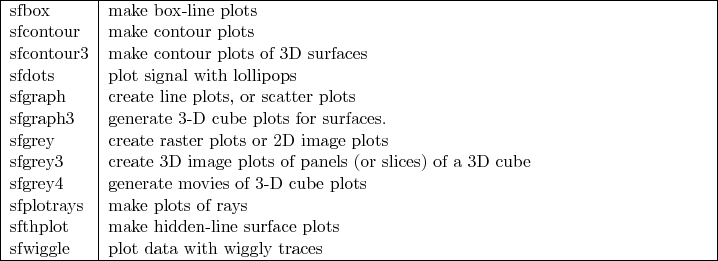
To generate VPLOT files, we need to pass our computed RSF files through VPLOT filters, that convert RSF data files to VPLOT files. The VPLOT filters are named by the type of plot that they produce. Table 1 lists all of the available VPLOT filters.
Table 1:
List of available plotting programs in Madagascar
 |
To actually create a plot, we can use the plotting programs on the command line in the same fashion that we would use a Madagascar program:
sfspike n1=100 | sfnoise > file.rsf
sfgraph < file.rsf title="noise" > file.vpl
2011-11-03