|
|
|
|
Lowrank one-step wave extrapolation for reverse-time migration |
|
|---|
|
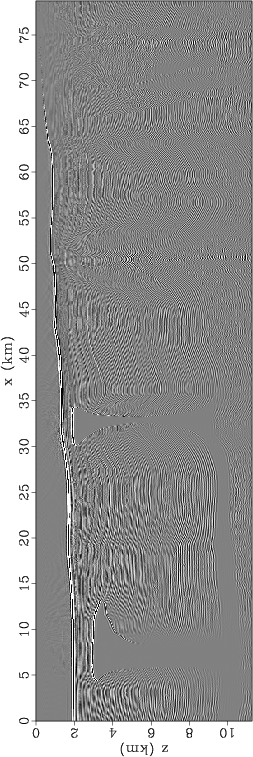
bptti-img
Figure 16. RTM image obtained using BP 2007 anisotropic data set. Acoustic approximation in TI medium is used to perform wave extrapolation. |
|
|
|
|
|
|
Lowrank one-step wave extrapolation for reverse-time migration |