|
|
|
|
Seismic data analysis using local time-frequency decomposition |
|
|---|
|
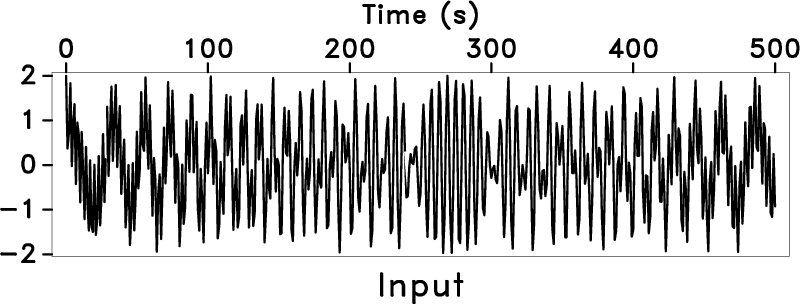
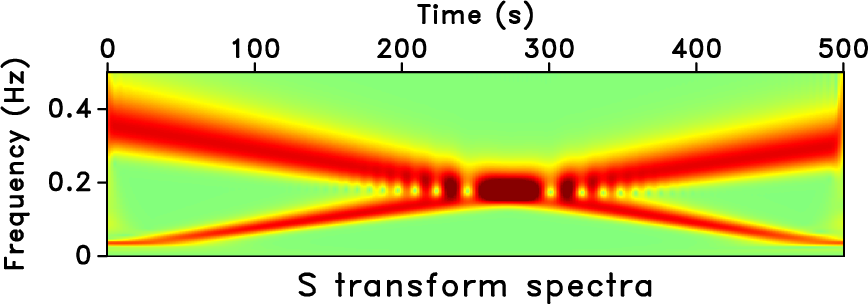
cchirps,st1
Figure 2. Synthetic signal with two crossing chirps (a) and time-frequency spectra from S transform (b). |
|
|
|
|---|
|
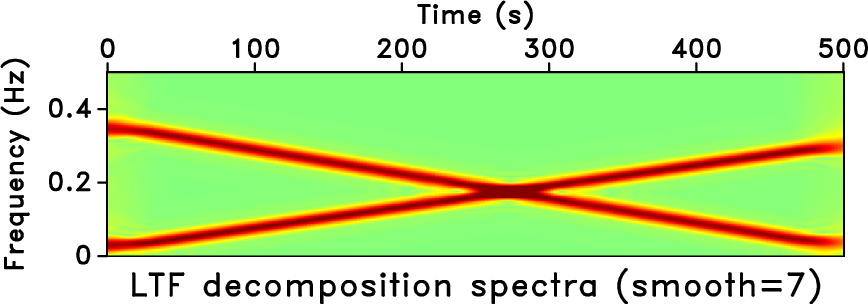
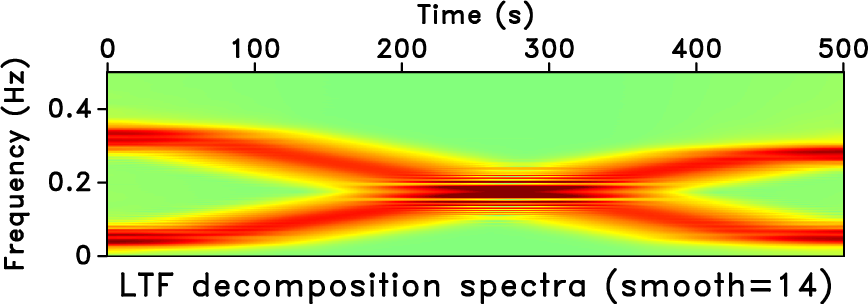
ltft1,ltft12
Figure 3. Time-frequency spectra from LTF decomposition with different sizes of the smoothing radius. Smoothing radius of 7 points (a) and smoothing radius of 14 points (b). |
|
|
|
|
|
|
Seismic data analysis using local time-frequency decomposition |