|
|
|
|
Iterative deblending of simultaneous-source seismic data using seislet-domain shaping regularization |

|
|---|
|
hyper1,hypers
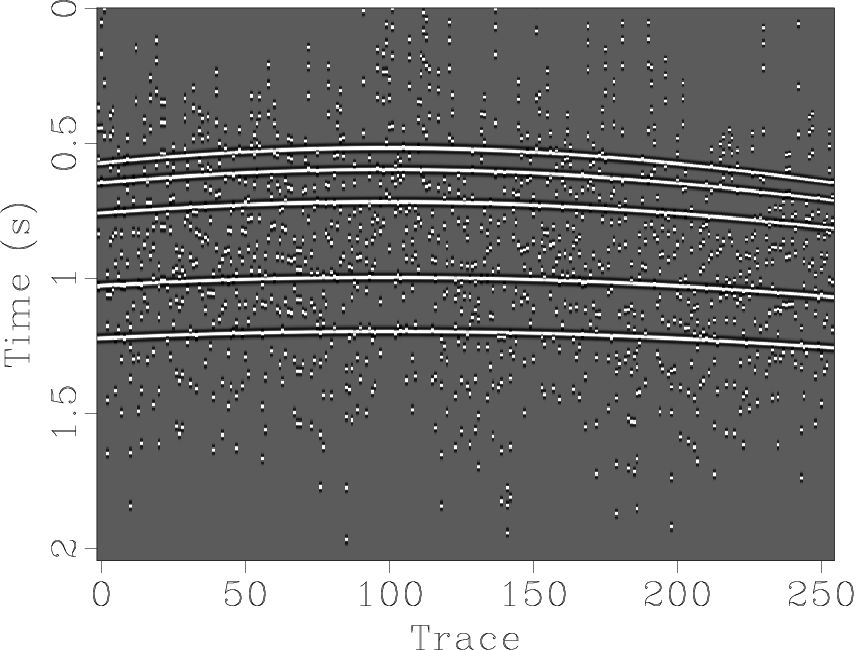
Figure 6. Numerically blended synthetic data (hyperbolic case). (a) Unblended data. (b) Blended data. |
|
|


|
|---|
|
hyperdeblendedfft1,hyperdeblendedslet1,hyperdeblendedfxdecon1,hyperdifffft1,hyperdiffslet1,hyperdifffxdecon1,hypererrorfft1,hypererrorslet1,hypererrorfxdecon1
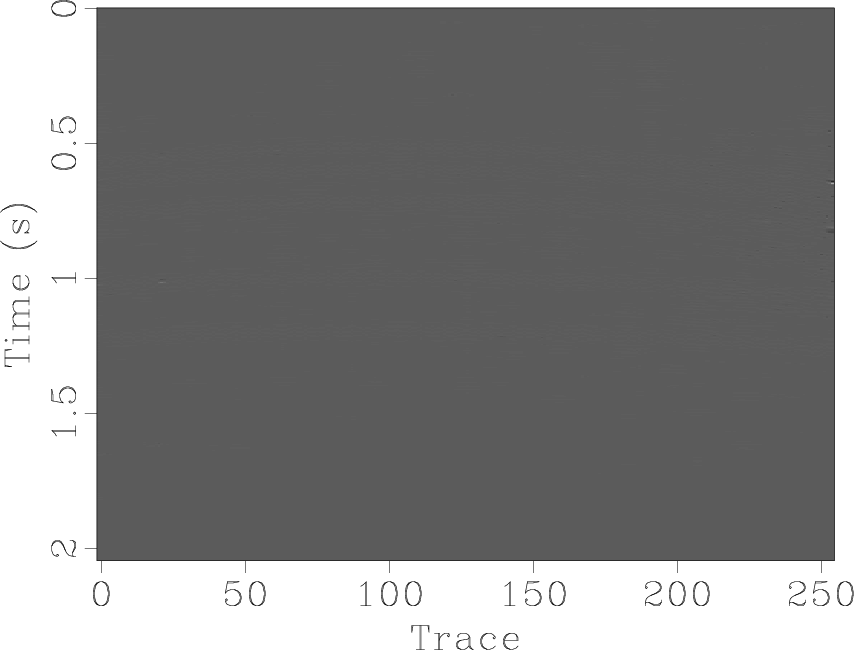
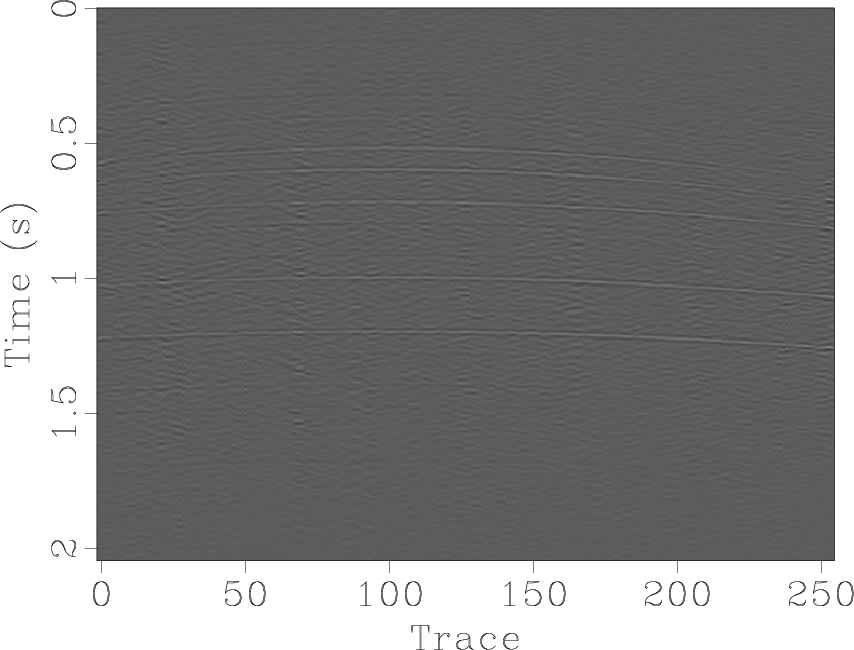
Figure 7. Deblending comparison for numerically blended synthetic data (hyperbolic case). (a) Deblended result using |
|
|

|
|---|
|
hypersnrsa
Figure 8. Diagrams of SNR for synthetic example (hyperbolic case). The "+" line corresponds to seislet-domain thresholding. The "o" line corresponds to |
|
|
|
|
|
|
Iterative deblending of simultaneous-source seismic data using seislet-domain shaping regularization |