|
|
|
|
Seismic AVO analysis of methane hydrate structures |
In the first preprocessing step, the data were corrected for time-varying spherical divergence. Next, we performed a single-trace source wavelet deconvolution in order to regularize the source wavelet with offset. The deconvolved data were then bandpass filtered to the original data bandwidth to remove spurious deconvolutional high-frequency noise. Using an initial semblance estimate of the best stacking velocity function, a normal moveout correction of the data was carried out.
Two main assumptions were made to perform the amplitude calibration. First, it
was assumed that an offset-dependent rather than an angle-dependent amplitude
correction was sufficient, since the difference between the maximal angle
of incidence at the seafloor (30![]() ) and the BSR reflection (33
) and the BSR reflection (33![]() ) is
negligibly small. Second, we assumed a functional form for the AVO response
of the seafloor reflection, based on the fluid-solid interface Zoeppritz
PP reflection
coefficient. Based on these assumptions, the amplitude calibration was
performed by scaling each trace to the seabottom amplitude to match the
predicted seafloor AVO as a function of offset.
) is
negligibly small. Second, we assumed a functional form for the AVO response
of the seafloor reflection, based on the fluid-solid interface Zoeppritz
PP reflection
coefficient. Based on these assumptions, the amplitude calibration was
performed by scaling each trace to the seabottom amplitude to match the
predicted seafloor AVO as a function of offset.
Due to the use of a nonlinear streamer to record the data, a trace interpolation of the near offset data was necessary to regularize the receiver cable group spacings. After applying an inverse NMO correction to the interpolated data, a high resolution NMO stacking velocity analysis was performed. Having derived a good stacking model for the data, they were reprocessed in a second iteration using the new velocities. Since it is essential for the subsequent impedance contrast estimation that the reflector moveout is very flat after NMO correction or migration, an additional static shift was applied preceding the amplitude scaling to correct for some small non-hyperbolic, offset-dependent residual moveout in the CMP gathers.
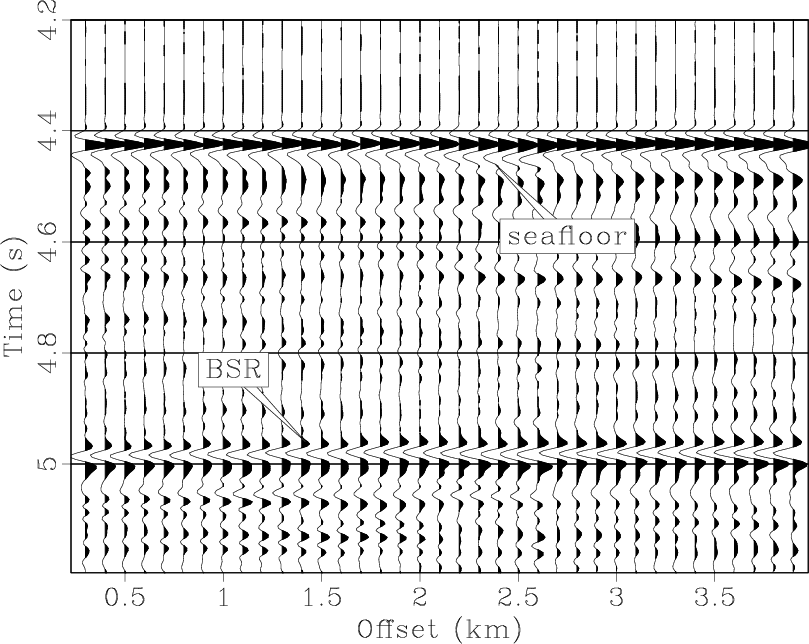
Figure 2 shows the final data after preprocessing. The gather contains a BSR AVO effect that is representative of the average trend along the entire line. Picking the peak amplitudes along the BSR yielded the AVO curve shown in Figure 3. Starting with a negative zero-offset reflection coefficient that was obtained by assuming a seafloor reflection of approximately 0.2, the amplitudes become increasingly negative with increasing offset.
|
|---|
|
bsr-ann
Figure 2. Final CMP gather after preprocessing containing an average AVO effect observed along the line. |
|
|

|
|---|
|
bsr-picks
Figure 3. AVO curve of the amplitude picks along the BSR. The near offset reflection amplitude was determined by assuming a seafloor reflection of approximately 0.2. |
|
|
|
|
|
|
Seismic AVO analysis of methane hydrate structures |