|
|
|
|
Madagascar tutorial |
bash$ cd ../channel2
bash$ scons local.rsfand
bash$ sfin local.rsfView a movie of different shifts by running
bash$ scons local.vpl
bash$ scons smoothed2.view
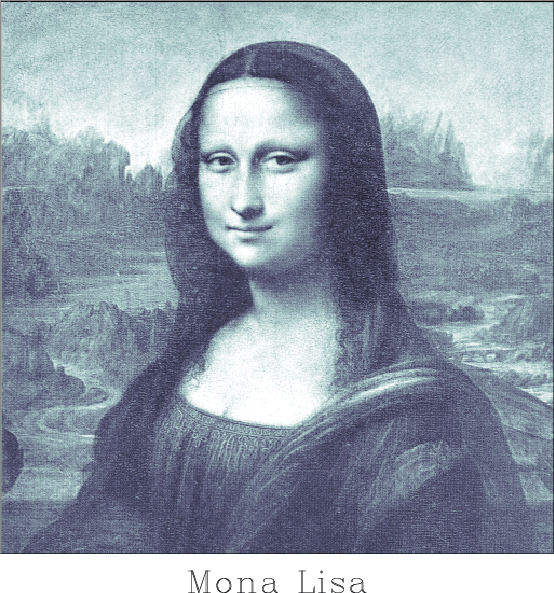
../mona and apply your method to the image of Mona Lisa. Can you extract her smile?
from rsf.proj import *
# Download data
Fetch('horizon.asc','hall')
# Convert format
Flow('horizon2','horizon.asc',
'''
echo in=$SOURCE data_format=ascii_float n1=3 n2=57036 |
dd form=native | window n1=1 f1=-1 |
add add=-65 | put
n1=196 o1=33.139 d1=0.01 label1=y unit1=km
n2=291 o2=35.031 d2=0.01 label2=x unit2=km
''',stdin=0)
Result('horizon2','grey yreverse=n color=j title=Input')
# Spray
Flow('spray','horizon2',
'''
spray axis=3 n=21 o=-0.1 d=0.01 |
spray axis=4 n=21 o=-0.1 d=0.01
''')
# Shift
Flow('shift1','spray','window n1=1 | math output=x2')
Flow('shift2','spray','window n2=1 | math output=x3')
Flow('local','spray shift1 shift2',
'''
datstretch datum=${SOURCES[1]} | transp |
datstretch datum=${SOURCES[2]} | transp
''')
Plot('local','window j3=4 j4=4 | grey color=j',view=1)
# -- CHANGE BELOW --
# try "exp(-0.1*(input-loc)^2-200*(x3^2+x4^2))"
Flow('simil','spray local',
'''
math loc=${SOURCES[1]} output=1
''')
Flow('norm','simil',
'stack axis=4 | stack axis=3')
Flow('smoothed2','local simil norm',
'''
add mode=p ${SOURCES[1]} |
stack axis=4 | stack axis=3 |
add mode=d ${SOURCES[2]}
''')
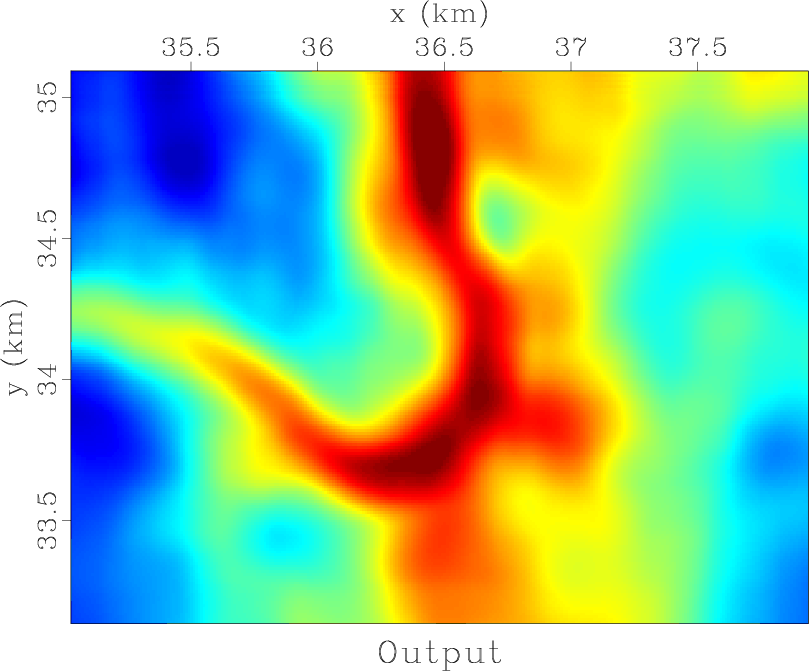
Result('smoothed2','grey yreverse=n color=j title=Output')
End()
|
|
smoothed2
Figure 12. Your final result. |
|
|---|---|
|
|
|
mona
Figure 13. Can you apply your algorithm to Mona Lisa? |
|
|---|---|
|
|
from rsf.proj import *

# Download data
Fetch('mona.img','imgs')

# Convert to standard format
Flow('mona','mona.img',
     '''
     echo n1=512 n2=513 in=$SOURCE data_format=native_uchar |
     dd type=float
     ''',stdin=0)

Result('mona',
       '''
       grey transp=n allpos=y title="Mona Lisa"
       color=b screenratio=1 wantaxis=n
       ''')

End()
|
|
|
|
|
Madagascar tutorial |