|
|
|
|
Seismic data analysis using local time-frequency decomposition |


|
|---|
|
vpp,vss
Figure 11. PP (a) and SS (b) images from a nine-component land survey. |
|
|

|
|---|
|
vnails
Figure 12. Three ``nails'' for PP and SS time correlation identified by initial image interpretation and fitted to a straight line. |
|
|


|
|---|
|
vect-ppft-0a,vect-psft-0a,vect-ppft-0c,vect-psft-0c
Figure 13. Time-frequency spectra in LTF decomposition domain. PP before balancing (a), SS after initial warping (b), PP after balancing (c), and warped SS after balancing (d). |
|
|

|
|---|
|
vect-psw-0c
Figure 14. Three stages for PP and SS registration. Initial warping (top), nonstationary spectral balancing (middle), and final registration after warping scan (bottom). |
|
|
Figure 11a and b show seismic images from compressional
(PP) and shear (SS) reflections obtained by processing a land
nine-component survey (Fomel, 2007a). One can use ``image warping''
(Wolberg, 1990) to squeeze the SS image to PP reflection
time and make the two images display in the same coordinate system.
Using initial interpretation and well-log analysis, we identified
three individual correlation ``nails'' in the terminology of
DeAngelo et al. (2003). Fitting a straight line through the nails suggests a
constant initial ![]() ratio (Figure 12). For
illustration of spectral balancing, we select the 300th trace in the
PP and SS images and then warp (squeeze) SS time to PP time by using
the initial
ratio (Figure 12). For
illustration of spectral balancing, we select the 300th trace in the
PP and SS images and then warp (squeeze) SS time to PP time by using
the initial ![]() ratio. The corresponding local time-frequency
spectra are shown in
Figures 13a
and b. The SS-trace frequency appears higher in the shallow part of
the image because of a relatively low S-wave velocity but lower in the
deeper part of the image because of the apparently stronger
attenuation of shear waves. Spectral balancing essentially smoothes
the high-frequency image to match the low-frequency image. The LTF
decompositions provide a nonstationary domain for
time-varying spectral balancing. Our spectral balancing works as
follows. For each time slice in LTF domains, we use three steps:
ratio. The corresponding local time-frequency
spectra are shown in
Figures 13a
and b. The SS-trace frequency appears higher in the shallow part of
the image because of a relatively low S-wave velocity but lower in the
deeper part of the image because of the apparently stronger
attenuation of shear waves. Spectral balancing essentially smoothes
the high-frequency image to match the low-frequency image. The LTF
decompositions provide a nonstationary domain for
time-varying spectral balancing. Our spectral balancing works as
follows. For each time slice in LTF domains, we use three steps:
|
|---|
|
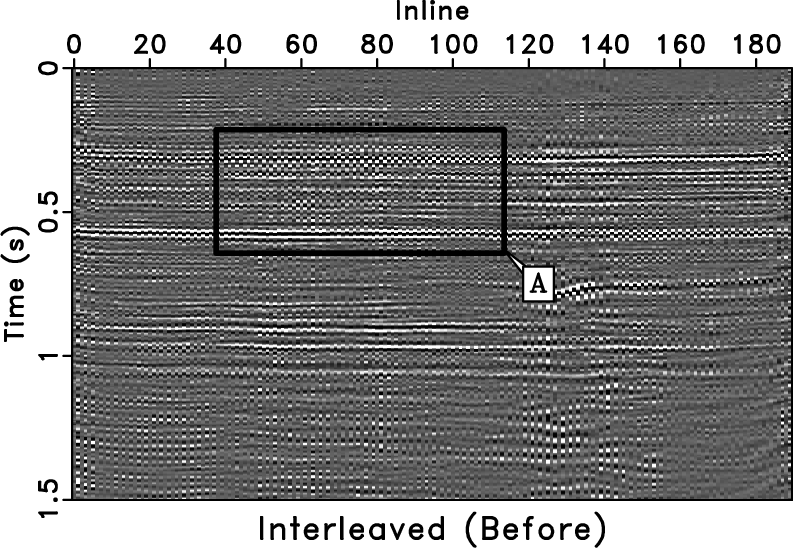
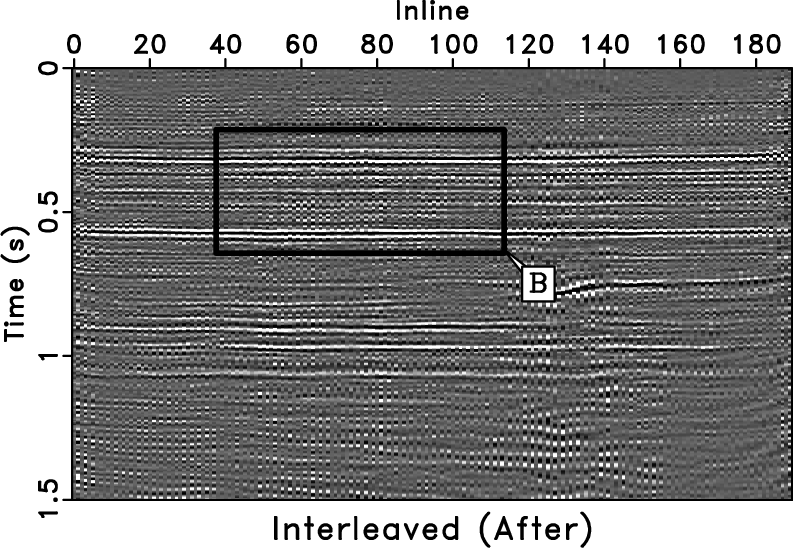
before,after
Figure 15. Interleaved traces from PP and SS images before (a) and after (b) multicomponent registration. |
|
|
|
|
|
|
Seismic data analysis using local time-frequency decomposition |