|
|
|
|
Signal and noise separation in prestack seismic data using velocity-dependent seislet transform |

|
|---|
|
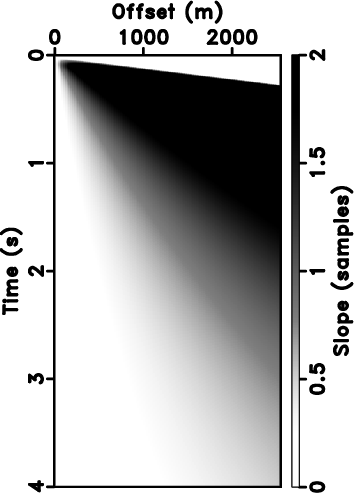
synt,sdip
Figure 1. Synthetic data (a) and slopes calculated by PWD (b). |
|
|
|
|---|
|
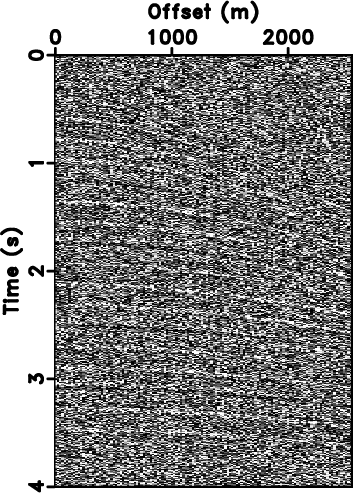
noise,pdip
Figure 2. Synthetic noisy data (a) and slopes calculated by PWD (b). |
|
|


|
|---|
|
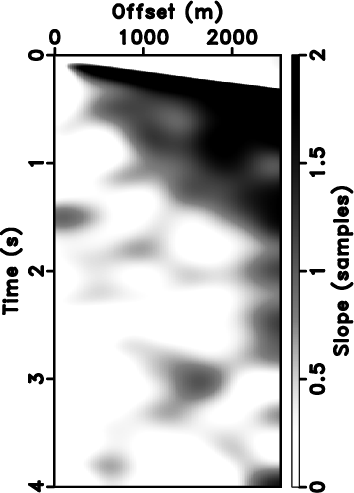
svsc2,vdip
Figure 3. Velocity scanning (dash line: exact velocity, solid line: picked velocity) (a) and VD slopes (b). |
|
|
A direct application of the seislet transform is denoising. We apply
both PWD-seislet and VD-seislet transforms on the noisy data
(Figure 2a). Figure 4a and
4b show the transform coefficients of PWD-seislet
and VD-seislet, respectively. The hyperbolic events are compressed in
both transform domains. Notice that PWD-seislet coefficients get more
concentrated at small scale than those of VD-seislet because parts of
the random noise are also compressed along inaccurate PWD
slopes. Meanwhile, random noise gets spread over different scales in
the VD-seislet domain, while the predictable reflection information
gets compressed to large coefficients at small scales, which makes
signal and noise display different amplitude
characteristics. Figure 4c shows a
comparison between the decay of coefficients sorted from large to
small in the PWD-seislet transform and the VD-seislet
transform. Seislet transform can compress the seismic events with
coincident wavelets, if the slopes of the reflections are correct, the
sparse large coefficients only correspond to the stacked reflection
events. However, when the slopes of the reflections are not accurate,
the stacked amplitude values for inconsistent wavelets will create
more coefficients with smaller values. VD slopes are less affected by
strong random noise than PWD slopes, which results in a faster decay of the VD-seislet
coefficients. A simple thresholding method can easily remove the small
coefficients of random noise. Figure 5a and
5b display the denoising results by using
PWD-seislet transform and VD-seislet transform, respectively. The
events after PWD-seislet transform denoising show serious distortion
while VD-seislet transform produces a reasonable denoising result. For
numerically comparison, we use the signal-to-noise ratio (SNR) defined
as
 , where
 ![]() is the
noise-free signal and
is the
noise-free signal and
![]() is the denoised signal. The
original SNR of the noisy data (Figure 2a) is
-12.53 dB. The SNR of the denoised results using the PWD-seislet
transform (Figure 5a) and the VD-seislet
transform (Figure 5b) are 0.53 dB and 1.94 dB,
respectively.
is the denoised signal. The
original SNR of the noisy data (Figure 2a) is
-12.53 dB. The SNR of the denoised results using the PWD-seislet
transform (Figure 5a) and the VD-seislet
transform (Figure 5b) are 0.53 dB and 1.94 dB,
respectively.


|
|---|
|
pseis,vseis,ccomp
Figure 4. PWD-seislet coefficients (a), VD-seislet coefficients (b), and transform coefficients sorted from large to small, normalized, and plotted on a decibel scale (Solid line - VD-seislet transform. Dashed line - PWD-seislet transform) (c). |
|
|


|
|---|
|
pclean,vclean
Figure 5. Denoising result using different transforms. PWD-seislet transform (a) and VD-seislet transform (b). |
|
|
|
|
|
|
Signal and noise separation in prestack seismic data using velocity-dependent seislet transform |