|
|
|
|
Multidimensional autoregression |
In any data interpolation or extrapolation, we want the extended data to behave like the original data. And, in regions where there is no observed data, the extrapolated data should drop away in a fashion consistent with its spectrum determined from the known region.
My basic idea is that the spectrum of the missing data should match that of the known data. This is is the idea that the spectrum should be unchanging from a known region to an unknown region. A technical word to express the idea of spectra not changing is ``stationary.'' This happens with the PEF (one-sided filter) because its spectrum tends to the inverse of that of the known data while that of the unknown data tends to the inverse of that of the PEF. Thus the spectrum of the missing data is the ``inverse of the inverse'' of the spectrum of the known. The PEF enables us to fill in the missing area with the spectral shape of the known area. (In regions far away or unpredictable, the spectral shape may be the same, but the energy drops to zero.)
On the other hand,
the interpolation-error filter,
a filter like
![]() ,
should fail to do the job because it has the wrong spectrum.
(I am stating this fact without proof).
,
should fail to do the job because it has the wrong spectrum.
(I am stating this fact without proof).
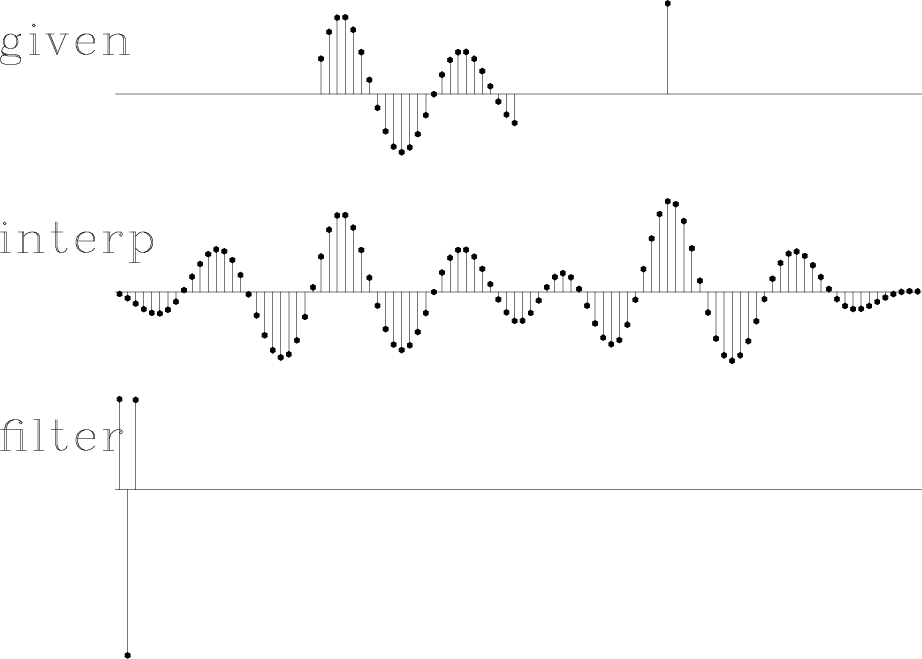
To confirm and show these concepts, I prepared synthetic data consisting of a fragment of a damped exponential, and off to one side of it an impulse function. Most of the energy is in the damped exponential. Figure 24 shows that the spectrum and the extended data are about what we would expect. From the extrapolated data, it is impossible to see where the given data ends.
|
syn1
Figure 24. Top is synthetic data with missing portions. Middle includes the interpolated values. Bottom is the filter, a prediction-error filter which may look symmetric but is not quite. |
|
|---|---|
|
|
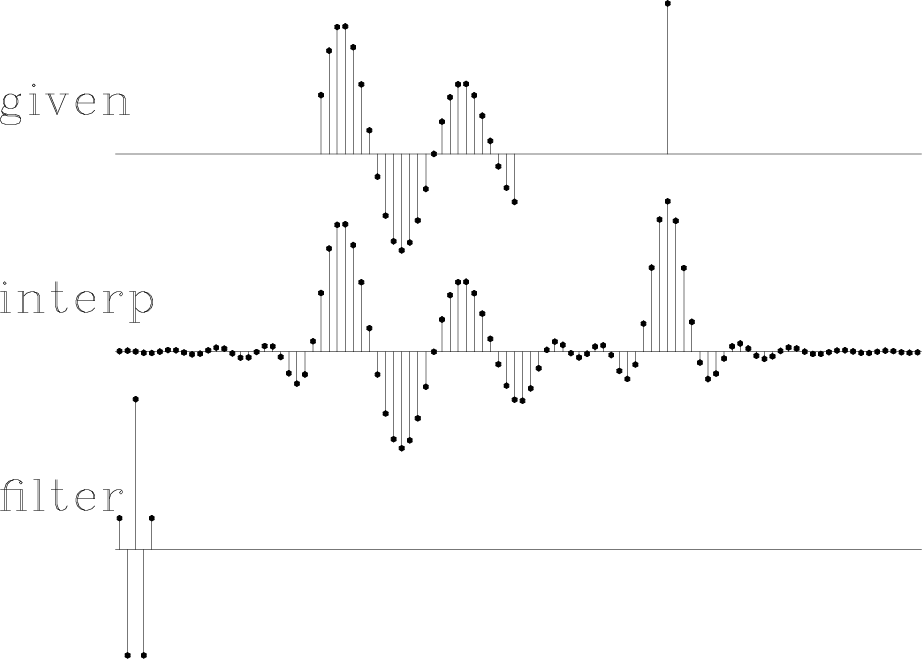
For comparison, I prepared Figure 25. It is the same as Figure 24, except that the filter is constrained in the middle. Notice that the extended data does not have the spectrum of the given data--the wavelength is much shorter. The boundary between real data and extended data is not nearly as well hidden as in Figure 24.
|
syn3
Figure 25. Top is the same synthetic data. Middle includes the interpolated values. Bottom is the filter, an interpolation-error filter. |
|
|---|---|
|
|
|
|
|
|
Multidimensional autoregression |