|
|
|
| Imaging in shot-geophone space | |
|
Next: Kjartansson's model for lateral
Up: TOMOGRAPY OF REFLECTION DATA
Previous: TOMOGRAPY OF REFLECTION DATA
The dataset Kjartansson studied was a seismic line across the Grand Isle
gas field, off the shore of Louisiana.
The data contain several classic ``bright spots'' (strong reflections)
on some rather flat undisturbed bedding.
Of interest are the lateral variations in amplitude
on reflections at a time depth of about 2.3 seconds on Figure 9.3.
It is widely believed that such bright spots
arise from gas-bearing sands.
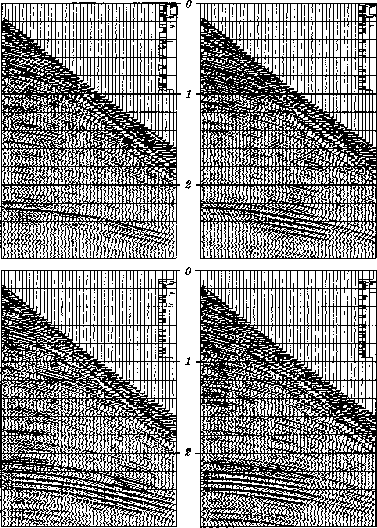
Theory predicts that reflection coefficient should
be a function of angle.
For an anomalous physical situation
like gas-saturated sands, the function should be distinctive.
Evidence should be found on common-midpoint gathers
like those shown in Figure 9.1.
|
---|
kjcmg
Figure 1.
Top left is shot point 210; top right is shot point 220.
No processing has been applied to the data except
for a display gain proportional to time.
Bottom shows shot points 305 and 315. (Kjartansson)
|
---|
|
---|
Looking at any one of these gathers you will note that the reflection
strength versus offset seems to be a smooth,
sensibly behaved function, apparently quite measurable.
Using layered media theory, however, it was determined that only
the most improbably bizarre medium could exhibit such strong
variation of reflection coefficient with angle,
particularly at small angles of incidence.
(The reflection angle of the energy arriving at wide offset at time 2.5 seconds
is not a large angle.
Assuming constant velocity,
).
Compounding the puzzle, each common-midpoint gather shows a
different
smooth, sensibly behaved, measurable function.
Furthermore, these midpoints are near one another,
ten shot points
spanning a horizontal distance of 820 feet.
|
|
|
| Imaging in shot-geophone space | |
|
Next: Kjartansson's model for lateral
Up: TOMOGRAPY OF REFLECTION DATA
Previous: TOMOGRAPY OF REFLECTION DATA
2009-03-16